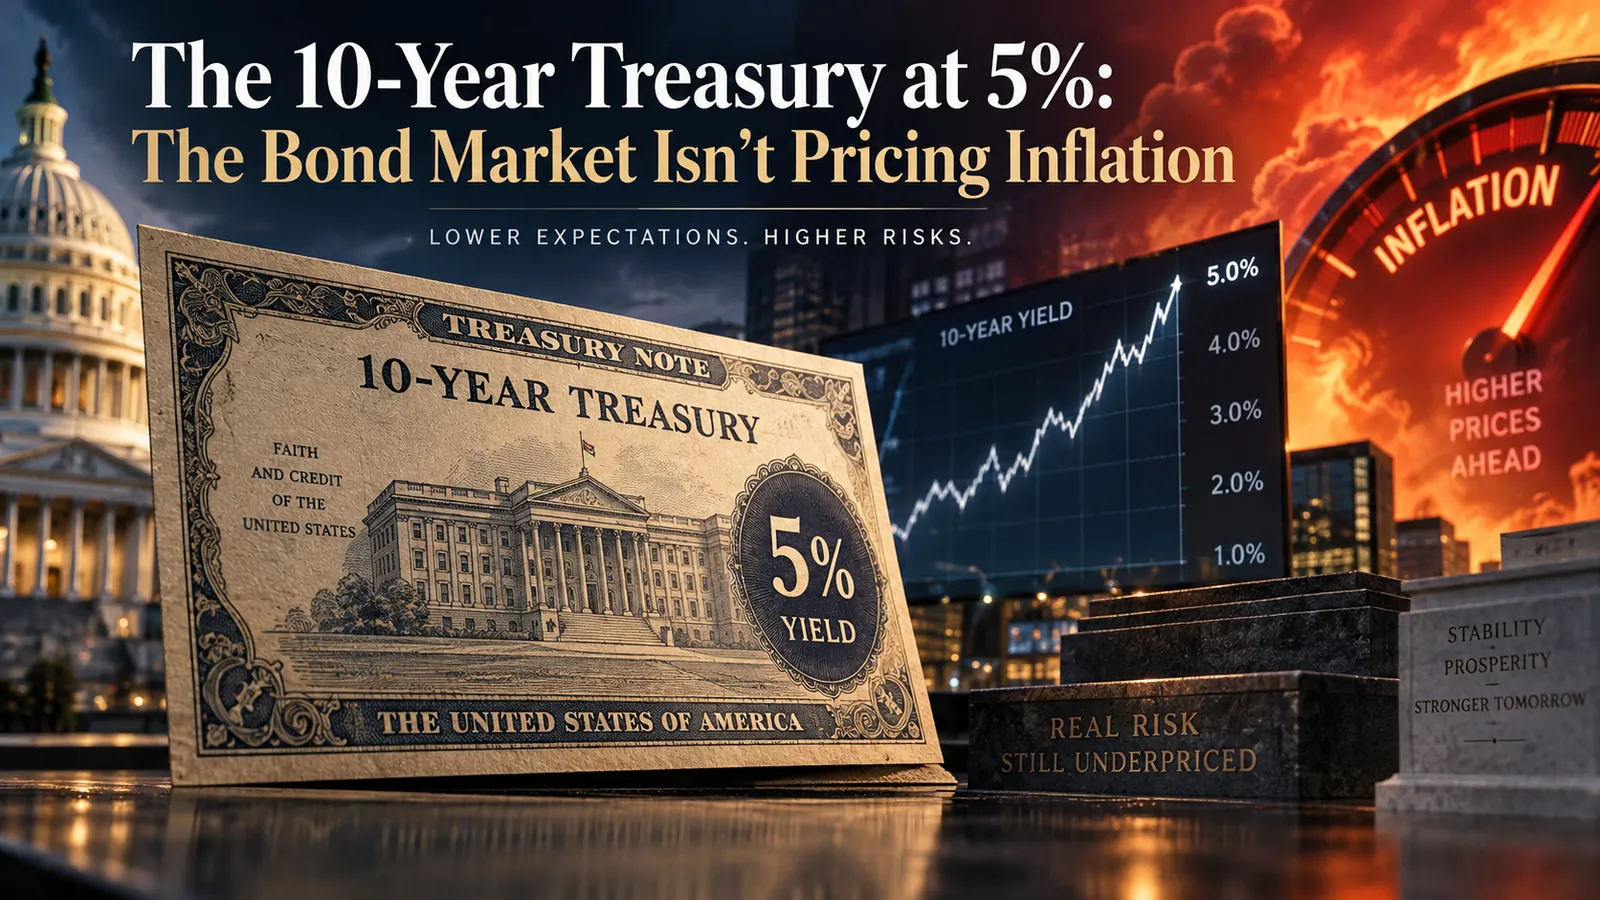
The 10-Year Treasury at 5%: The Bond Market Isn’t Pricing Inflation
Key takeaway
The 10-year Treasury closed at 5.01% on 16 and 18 September 2026, the highest since July 2007, after the Fed's first hike in more than three years. Since 1 May the whole rise has been in real yields: breakeven inflation fell from 2.48% to 2.33%, while consumers now expect 4.6% inflation next year.
A week after the Federal Reserve raised rates for the first time in more than three years, the Nasdaq Composite closed at a record on Monday and again on Tuesday. On the face of it the two cannot both be right: a central bank tightening into an oil shock is not the usual backdrop for new highs in technology stocks. The number that reconciles them sits in the bond market, and it is not the one in the headlines.
The headline number is 5%. The 10-year Treasury yield closed at 5.01% on 16 and 18 September, the highest close in the Treasury’s daily series since 19 July 2007. The number that matters is what that 5% is made of. Since 1 May, the 10-year yield has risen 0.57 percentage points. Over the same period the inflation rate the bond market is pricing over the next decade has fallen, from 2.48% to 2.33%. The whole rise, and a little more, is in the real yield. Bond investors are not betting that the oil shock turns into lasting inflation. Consumers are: they now expect 4.6% over the next year.
Where things stand after Tuesday’s close
| Measure | 1 May 2026 | 22 Sep 2026 | Change |
|---|---|---|---|
| S&P 500 | 7,230.12 | 7,764.64 | +7.4% |
| Nasdaq Composite | 25,114.44 | 27,244.28 (record) | +8.5% |
| Dow Jones Industrial Average | 49,499.27 | 51,863.69 | +4.8% |
| Federal funds target range | 3.50%–3.75% | 3.75%–4.00% | +0.25 pts |
| 2-year Treasury yield | 3.88% | 4.71% | +0.83 pts |
| 10-year Treasury yield | 4.39% | 4.96% | +0.57 pts |
| 10-year real yield (TIPS) | 1.91% | 2.63% | +0.72 pts |
| 10-year breakeven inflation | 2.48% | 2.33% | −0.15 pts |
Index levels are closing values; yields are the Treasury’s daily par yield and par real yield curves. Breakeven is our own subtraction of the second from the first. The index closes and the Fed’s range in the May column are the ones quoted in our May 2026 market update, so the two pieces can be read side by side.
The Fed hiked into an energy shock, not a core-inflation problem
On 16 September the Federal Open Market Committee raised the target range by a quarter point, to 3.75%–4.00%, in a unanimous 12–0 vote. The statement was short on hedging: “Inflation remains elevated,” and the move “will support a timelier return to the Committee’s 2 percent goal.” It also noted that “uncertainty remains elevated owing, in part, to geopolitical developments.”
The inflation it is responding to is overwhelmingly energy. The August CPI, published on 11 September, showed all-items prices up 3.4% over twelve months, with energy up 16.3% and gasoline up 27.4%; gasoline alone accounted for more than a third of August’s 0.4% monthly rise. Excluding food and energy, prices were up 2.4% on the year.
So why hike? Because of what people expect next. The University of Michigan’s preliminary September survey put year-ahead inflation expectations at 4.6%, up from 4.0% in August and the highest since June, with the 5–10 year measure at 3.4%. A central bank can look through a supply shock only for as long as households believe it is temporary. The hike reads as a bet that they are starting not to.
The Fed’s own projections say it may not be done. The median year-end 2026 projection for the federal funds rate is 4.1%, which corresponds to the 4.00%–4.25% range — one more quarter-point increase before the year is out. In June the same median was 3.8%. Headline PCE inflation is projected at 3.7% for 2026, measured fourth quarter over fourth quarter. The next meeting is on 27–28 October.
The climb to 5% came from real yields, not inflation
A nominal Treasury yield can be split into two parts: the real yield, which you can observe directly on inflation-protected Treasuries (TIPS), and the gap between the two, the breakeven inflation rate. Breakeven is a rough gauge rather than a clean forecast — it also carries an inflation risk premium and the lower liquidity of TIPS — but its direction is hard to argue with.
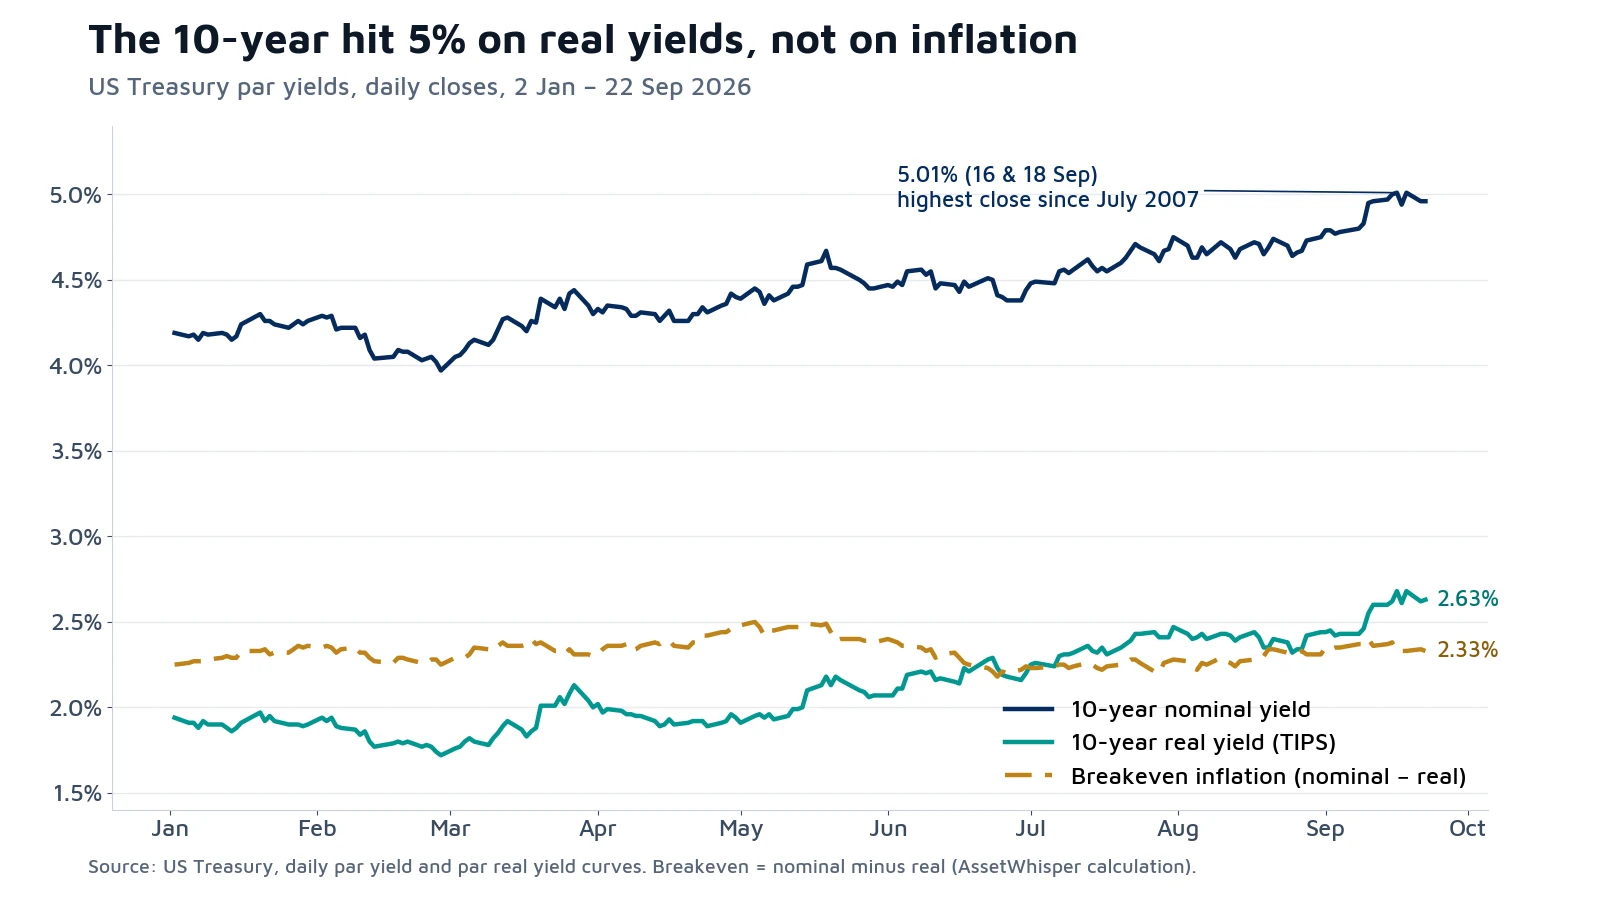
| Date | 10-year nominal | 10-year real | Breakeven |
|---|---|---|---|
| 2 Jan 2026 | 4.19% | 1.94% | 2.25% |
| 27 Feb 2026 (year’s low) | 3.97% | 1.72% | 2.25% |
| 1 May 2026 | 4.39% | 1.91% | 2.48% |
| 16 Sep 2026 (Fed decision) | 5.01% | 2.68% | 2.33% |
| 22 Sep 2026 | 4.96% | 2.63% | 2.33% |
Read down the last column. With energy prices up 16.3% on the year and gasoline up by more than a quarter, the bond market’s decade-ahead inflation estimate is lower than it was in May, and barely above where it started the year. The same holds at five years: the 5-year breakeven has gone from 2.69% on 1 May to 2.32%.
What rose instead is the real yield, by 0.72 points since May. That is the price of money after inflation, and it is what a tighter Fed, a larger supply of government debt or a higher term premium would push up. We went through those mechanisms in why bond yields rise even when central banks cut; this month they are running with the Fed rather than against it.
The gap is the story of the week. Households expect 3.4% a year over the next five to ten years; the bond market prices about 2.3% over ten. The horizons are not identical and the measures are built differently, but a gap of about a point is wide, and which side gives way will decide whether September’s hike was the first of several or the last.
Why stocks rallied anyway
Monday is the clearest illustration of what equities are trading. The S&P 500 rose 1.5%, the Nasdaq 2.3% to a record, and the Dow 0.7%, on a day with no major economic data. What moved was the price of risk around the Strait of Hormuz: oil futures fell on hopes of US–Iran diplomacy, and the 10-year yield slipped back under 5%, to 4.96%. With the discount rate easing, the market went straight back to the AI trade. Intel rose 12%, Meta 11% on the reception of its Muse AI agent, and AMD’s rally took its market value to around $1 trillion.
Tuesday was narrower — the S&P 500 flat, the Dow down 0.4%, the Nasdaq up 0.45% to a second record — but it had the same driver. Brent crude futures slipped below $100 to a two-week low after Iran signalled it could reopen Hormuz within seven days if the US eased military pressure and lifted its blockade, and President Trump told the UN General Assembly that he expects a deal with Iran after the November midterms, while saying the alternative was to “annihilate” the country.
How fragile that is shows in the week before the Fed. In the EIA’s daily spot series, WTI at Cushing went from $94.21 on 8 September to $107.02 on 15 September, a rise of about 14% in five trading days. The rally this week is the reverse of that move, and it rests on a negotiation whose conditions — Iran’s foreign minister set out the lifting of the blockade and the release of frozen assets — are a long way from agreed.
What to watch next
- Thursday 24 September — Trump–Xi summit at the White House. Tariffs, rare earths and AI are on the agenda, and Washington has reportedly held back new tariffs until after the meeting. The last round, in Beijing in May, is covered in what the G2 reset meant for portfolios.
- Friday 25 September — final Michigan survey for September. Whether the 4.6% year-ahead reading holds or rises is the most direct read on the risk the Fed is fighting.
- Wednesday 30 September — August PCE and the third estimate of Q2 GDP. PCE is the Fed’s preferred inflation gauge; the split between headline and core will show how far energy has spread.
- 27–28 October — next FOMC meeting. The median projection already pencils in one more hike this year.
- 3 November — US midterm elections. The timeline President Trump has now attached to an Iran deal. How markets have historically behaved around midterms is in our midterms piece.
What this changes for a portfolio
A real 10-year yield of 2.63% means inflation-protected Treasuries now offer a return above inflation of about that size, before tax, for a buyer who holds them to maturity. It also means the hurdle for everything else has gone up. That includes emerging-market debt: Argentina’s country risk widened from about 400 basis points in July to above 550 by 24 September, partly on these same US yields — the background is in how Milei rebuilt Argentina’s economy, and what the bond market has and has not priced. The equity rally since May has come with a higher real discount rate, not a lower one, which puts more weight on earnings actually arriving. How little that leaves stocks over a real bond is measured in the equity risk premium against real yields.
The other lesson is about correlation. On Monday, stocks and bonds rose together because both were responding to the same thing: oil. In a supply shock, bonds can stop diversifying equities exactly when that is needed, which is why a rule-based rebalancing discipline and a view on what the 60/40 portfolio still does matter more than a forecast of where Brent will be in November.
What this does not say
It does not say where yields or stocks go next. Two trading days are a small sample, breakeven inflation is an imperfect measure of expectations, and a single event — a deal over Hormuz, or its collapse — could reverse every move described here. It does not say the Fed is right or wrong to hike. And nothing here is a recommendation to buy or sell any security.
Frequently asked questions
Why did the Fed raise rates in September 2026?
To stop an energy-driven rise in prices from becoming lasting inflation. Headline CPI was 3.4% in August, but excluding food and energy it was 2.4%. What worried the Fed was expectations: consumers’ year-ahead inflation expectations rose to 4.6% in September.
Is the 10-year Treasury yield at its highest since 2007?
Yes, on the Treasury’s daily par yield series. The 10-year closed at 5.01% on 16 and 18 September 2026, the highest close since 19 July 2007. It was 4.96% on 22 September. Update, 25 September: it closed higher still, at 5.18% on 24 September, the highest close since 6 July 2007.
What is breakeven inflation?
The difference between a nominal Treasury yield and the yield on an inflation-protected Treasury (TIPS) of the same maturity. It is a rough gauge of the inflation the bond market is pricing. The 10-year breakeven was 2.33% on 22 September, down from 2.48% on 1 May.
Why did the Nasdaq hit a record the week after a Fed hike?
Oil prices and bond yields fell on hopes of US–Iran diplomacy, which eased the discount rate markets apply to future earnings, and chip and AI stocks led: Intel rose 12% and Meta 11% on Monday 21 September.
Sources
- Federal Reserve, FOMC statement, 16 September 2026, and Summary of Economic Projections, same date (median federal funds rate, PCE inflation). Meeting calendar: FOMC calendars.
- US Treasury, daily par yield curve rates and daily par real yield curve rates, 2026; 2007 to 2025 series checked for the “highest since” comparison. Breakeven figures are our subtraction of the real from the nominal par yield.
- US Bureau of Labor Statistics, Consumer Price Index, August 2026, released 11 September 2026.
- University of Michigan, Surveys of Consumers, preliminary September 2026 results (year-ahead and 5–10 year inflation expectations).
- US Energy Information Administration, daily spot prices for crude oil, WTI Cushing, 8–15 September 2026 (release of 16 September).
- US Bureau of Economic Analysis, release schedule (Personal Income and Outlays, August 2026; GDP third estimate, Q2 2026).
- Index closes and daily moves for 21–22 September 2026: Yahoo Finance market reports of 22 September and the 22 September live coverage. Oil futures on 22 September: Reuters via Yahoo Finance.
- President Trump’s UN General Assembly remarks and Iran’s conditions: NBC News, 22 September 2026. Summit agenda: CNBC, 21 September 2026.
Related reading
- Japanese government bonds at 3% — why hedged Treasuries now yield less than JGBs for the largest foreign holder of US debt.
- Why bond yields rise when central banks cut rates — the term premium and duration arithmetic behind this week’s numbers.
- May 2026 market update — the starting point for every comparison above.
- How interest rates shape investment choices — what a higher real rate changes asset by asset.
- Why your savings lose value every year — the inflation side of the same arithmetic.
- Crisis-proof investments — which exposures held up in earlier shocks.
- Bear markets since 1950 — how long recoveries actually took, for perspective on a record high.
- Yield curve inversions and recessions — what the nine inversions since 1953 were followed by, including the record one of 2022–2024.
This article is general information, not personalised investment advice. It does not take into account the financial situation, objectives or risk tolerance of any individual reader, and the same text is distributed to all readers. Market data describe the dates stated and change continuously; past performance does not indicate future results. Capital is at risk.