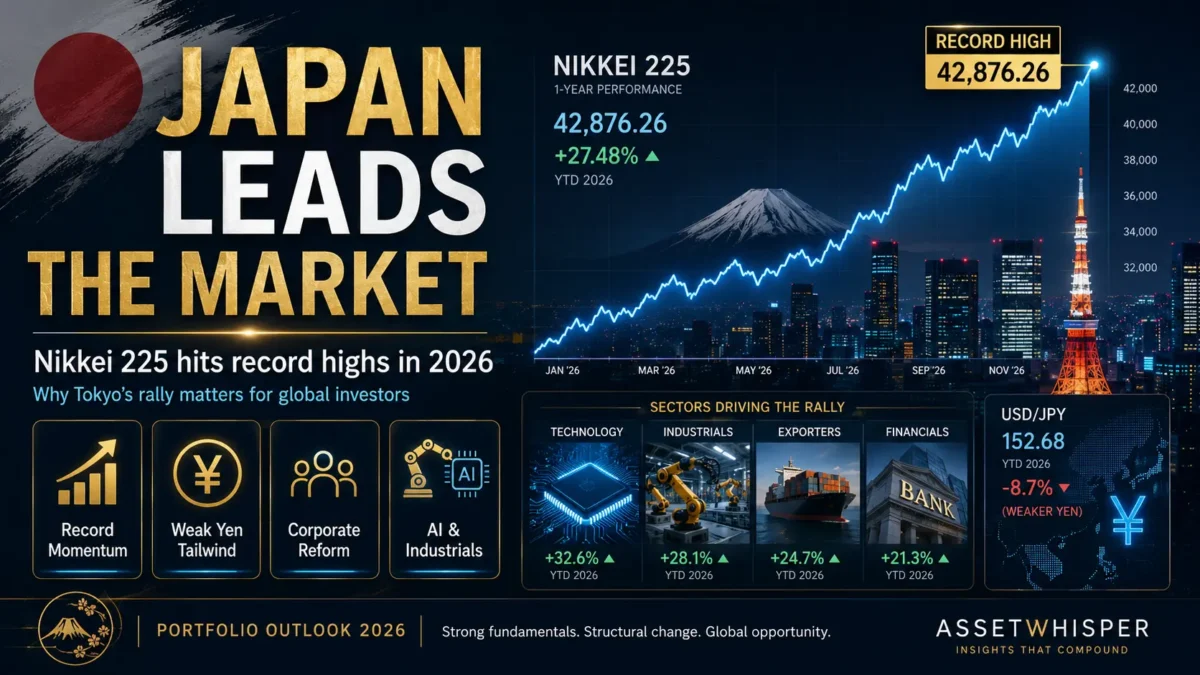
While most investors have spent 2026 fixated on Wall Street, the artificial intelligence rally, and the gyrations of gold and oil, the single best-performing major stock market in the world has been on the other side of the Pacific. Japan's Nikkei 225 crossed 62,000 on a closing basis for the first time in history on May 6, 2026, and the following session it delivered the largest single-day point gain ever recorded — a surge of 3,320.72 points, or roughly 5.6%, closing at 62,833.84 after briefly topping 63,000 intraday. Through mid-May, the index is up approximately 24% year to date, leaving the S&P 500's gain of around 8.3% far behind and making the Nikkei the standout performer among the world's large benchmarks.
For investors who hold mostly domestic assets — and that describes the overwhelming majority of retail investors everywhere — this is more than a piece of foreign market trivia. It is a live, expensive lesson in the cost of home bias. A diversified global investor captured a chunk of that 24% return. A purely domestic investor captured none of it. The Nikkei's record run is a reminder that opportunity is global, that leadership rotates between regions, and that the portfolio which only owns its home market is making a concentrated bet whether the investor realizes it or not.
This article unpacks what is actually driving Japan's record-breaking year, why the rally is tightly bound to the same AI forces lifting US markets, the single most important risk that Japanese equity investors must understand — the yen — and the practical, structured ways an investor can add international diversification without simply chasing a hot market at the top.
To understand whether Japan's rally is an opportunity, a warning, or both, an investor first needs to understand the mechanics of how it unfolded — because the timing and the drivers reveal a great deal about its durability.
The explosive move came on May 7, 2026, when the Tokyo market reopened after an extended Golden Week holiday closure. During the days Japanese markets were shut, global equities — and US technology stocks in particular — had staged a powerful rally. Wall Street's tech-heavy Nasdaq Composite had climbed hundreds of points and set consecutive record highs, propelled by strong artificial intelligence chip earnings and renewed optimism that the US and Iran were moving toward a deal to end their conflict, which sent oil prices sharply lower.
When Tokyo reopened, it effectively had to price several sessions of global gains into a single day. The result was the largest one-day point gain in the index's history, surpassing the previous record set in August 2024. Roughly 30 of the 33 industry sectors on the Tokyo Stock Exchange advanced, with advancing stocks outnumbering decliners by more than three to one. The broader Topix index, which is more representative of the overall market than the price-weighted Nikkei, also surged and traded near its own record high.
The standout single name was SoftBank Group, the technology-focused investment conglomerate, whose shares soared more than 18% in their best single session since 2020. SoftBank's move was driven by the market value of its technology holdings, including its stake in chip designer Arm Holdings and its exposure to the broader AI investment landscape. Japanese semiconductor and chip-equipment names rallied hard alongside it — companies that manufacture the testing equipment, lithography tools, and chips that sit deep inside the global AI supply chain.
In the days that followed, the index consolidated near its records rather than collapsing, a sign that the move was not purely a one-day spike. By the May 14 session, the Nikkei had eased modestly to around 62,900 as investors locked in profits — SoftBank itself pulled back several percent despite reporting a sharp rise in quarterly profit — while market participants turned their attention to the Trump-Xi summit in Beijing and its implications for trade.
The key takeaway from the anatomy of the rally is that Japan did not decouple from the global narrative. It amplified it. The same AI-driven forces lifting US markets are lifting Japanese markets, which has important implications for diversification that we will return to below.
A single explosive session can be explained by holiday timing. A 24% year-to-date gain that leads every other major market cannot. Beneath the May fireworks sit four structural forces that have made Japan one of the most compelling equity stories of 2026.
The artificial intelligence boom is often framed as an American story, but the physical supply chain that makes AI possible runs straight through Japan. Japanese companies are global leaders in semiconductor manufacturing equipment, chip-testing systems, advanced materials, precision components, and the specialized machinery without which no advanced chip can be produced anywhere in the world.
This means Japanese equities offer exposure to the AI build-out that is different in character from owning US chip designers or hyperscalers. It is exposure to the "picks and shovels" layer — the equipment and materials suppliers whose order books fill up regardless of which specific AI model or platform ultimately wins. For investors who believe in the long-term AI capital expenditure cycle but worry about the valuations of the most obvious US names, the Japanese supply-chain layer is a genuinely different way to express the same thesis. It complements rather than duplicates the exposure found in many AI-focused ETFs, and it connects to the broader universe of emerging technologies reshaping financial markets and the real economy.
One of the most underappreciated forces behind Japan's multi-year re-rating is a sustained push to reform corporate governance. For decades, Japanese companies were known for hoarding cash, holding sprawling cross-shareholdings in one another, and prioritizing almost everything ahead of the shareholder. That has been changing. Pressure from the Tokyo Stock Exchange, regulators, and activist investors has pushed companies to unwind cross-shareholdings, improve returns on equity, raise dividends, and buy back shares.
This is a slow-moving but powerful tailwind because it changes the fundamental value proposition of Japanese equities. A market where companies are increasingly focused on shareholder returns deserves a higher valuation multiple than one where they are not. The re-rating is not finished, which is part of why several global investors continue to view Japan as a place to identify assets that remain undervalued relative to their improving fundamentals.
Japan spent the better part of three decades fighting deflation — a corrosive environment in which falling prices encourage consumers and companies to delay spending, which suppresses growth further. The recent shift toward sustained, moderate inflation, accompanied by the first meaningful wage growth in a generation, has changed the domestic economic backdrop. Inflation is uncomfortable for consumers in the short term, but for an economy emerging from chronic deflation, it can be a sign of returning vitality: companies gain pricing power, nominal revenues grow, and the incentive structure shifts toward investment and consumption.
This regime change interacts directly with monetary policy. As Japan normalizes away from its long era of ultra-loose policy, the path of interest rates becomes a central variable for both equities and the currency — which is exactly why understanding the impact of interest rates on investment choices is essential before allocating to Japan.
For much of the recent period, a relatively weak yen has flattered the earnings of Japan's large export-oriented companies. When the yen is weak, the overseas revenues of exporters — automakers, electronics firms, machinery producers — translate back into more yen, inflating reported profits and supporting share prices. This currency tailwind has been a meaningful contributor to the earnings strength behind the rally.
But this driver comes with a sharp double edge, and it is so important for foreign investors that it deserves its own full section.
Here is the concept that separates investors who genuinely understand Japanese equities from those who simply see a rising chart: when you buy Japanese stocks as a foreign investor, you are making two bets at once. You are betting on the stocks, and you are betting on the yen. Your total return is the combination of the two, and the currency leg can either amplify your equity gains or quietly erase them.
Consider the mechanics. If the Nikkei rises 10% in yen terms but the yen weakens 10% against your home currency over the same period, your return as a foreign investor is close to zero — the equity gain is cancelled by the currency loss when you convert back. Conversely, if the Nikkei rises 10% and the yen also strengthens 10%, your return is amplified to roughly 20%. The currency is not a footnote. It is half the trade.
This dynamic is made more complex by the fact that the yen and Japanese exporters often move in opposite directions. Yen weakness boosts exporter earnings, which can lift the Nikkei in local terms — but that same yen weakness erodes the foreign investor's converted return. Yen strength does the reverse: it can pressure exporter earnings and the local index, while improving the foreign investor's currency translation. The two legs of the trade partially offset each other, which is genuinely useful to understand but is not the same as being fully hedged.
The yen's path in 2026 is being shaped by several forces at once: the interest rate differential between Japan and other major economies, shifts in global risk appetite, and the prospect of official intervention, which has been observed in recent sessions. For a foreign investor, the practical implication is a single critical decision: currency-hedged exposure or unhedged exposure.
A currency-hedged Japan position strips out the yen movement, leaving the investor with something close to the pure equity return that a local Japanese investor would experience. A hedged vehicle is appropriate for an investor who has a view on Japanese stocks but does not want to take a currency view, or who expects the yen to weaken.
An unhedged Japan position leaves the investor exposed to the full yen movement. This is appropriate for an investor who wants the currency diversification — the yen has historically had safe-haven characteristics and can appreciate during global risk-off episodes — or who expects the yen to strengthen.
Neither choice is universally correct. What is universally correct is making the choice deliberately rather than by accident. An investor who buys a Japan fund without knowing whether it is hedged has taken a currency position without deciding to. Building this kind of awareness into the allocation process is a core part of serious investment hedging strategy and of managing risk across a portfolio.
Step back from Japan specifically, and the 2026 Nikkei story illustrates one of the most expensive and least examined mistakes in retail investing: home bias, the tendency to hold a portfolio overwhelmingly concentrated in one's own domestic market.
Home bias feels safe. Domestic companies are familiar, their news is in the investor's language, and their fortunes seem easier to follow. But familiarity is not the same as diversification, and comfort is not the same as safety. An investor whose entire equity allocation sits in a single national market is exposed to that country's specific political risks, currency, demographic trajectory, sector composition, and economic cycle. When that single market underperforms — and every market underperforms eventually — there is nothing in the portfolio to offset it.
The numbers from 2026 make the cost concrete. The gap between the Nikkei's roughly 24% year-to-date gain and the S&P 500's roughly 8.3% is not a rounding error. It is the difference between two completely different portfolio outcomes, and it accrued to investors who happened to have international exposure and was missed entirely by those who did not. Next year the leadership could easily rotate back, or to Europe, or to emerging markets. The investor cannot know in advance which market will lead. That uncertainty is precisely the argument for owning several of them.
This does not mean abandoning the home market or chasing whichever country topped the table last year — that would simply be one of the most common mistakes in stock market investing dressed up in a passport. It means building a deliberate, permanent allocation to international equities as a structural feature of the portfolio, sized according to the investor's goals and risk tolerance, and rebalanced with discipline. The principle is the same one that underpins investing in the financial markets the right way: genuine diversification across uncorrelated or partially correlated return streams.
Once an investor has decided that international diversification belongs in the portfolio, the question becomes structural: which vehicle delivers the exposure with the right balance of cost, simplicity, and control? Several options exist, each with a distinct profile.
The most straightforward route for most investors is a broad Japan equity ETF that tracks the Nikkei 225, the Topix, or a similar benchmark. These vehicles offer instant diversification across hundreds of Japanese companies, low expense ratios, intraday liquidity, and the operational simplicity of a normal brokerage account. The single most important selection criterion, as discussed above, is whether the fund is currency-hedged or unhedged — and many ETF families offer both versions of essentially the same portfolio, letting the investor choose the currency stance explicitly.
For investors who do not want to make a single-country call at all, a broad international developed-markets fund or an all-world ex-domestic fund provides exposure to Japan as part of a wider basket that also includes Europe, the rest of developed Asia, and often emerging markets. This is the lowest-maintenance way to cure home bias: a single holding that ensures the portfolio is never entirely dependent on one country's fortunes. The trade-off is less control — the investor gets Japan's weight as determined by the index, not as chosen deliberately.
An investor whose interest in Japan is specifically about the AI supply chain might consider a thematic fund focused on global semiconductors or technology hardware, which would typically carry significant Japanese weight alongside US, Taiwanese, and South Korean names. This is a more concentrated, higher-conviction approach and should be sized accordingly. It overlaps conceptually with the kind of exposure many investors already hold through AI ETFs, so investors should check they are not unintentionally doubling up on the same underlying companies.
A number of the largest Japanese companies trade as American Depositary Receipts on US exchanges, allowing direct ownership of individual names without a foreign brokerage account. This route gives the most control and the most concentration — and therefore demands the most homework. Picking individual Japanese stocks requires genuine company-level analysis, comfort with different disclosure conventions, and a clear-eyed understanding of single-name risk. For most investors, this should be a small satellite position around a diversified core, not the core itself. Anyone going this route should ground the decision in solid fundamental and technical analysis.
Investors who would rather not make these allocation and currency decisions themselves can access international diversification through managed solutions, including robo-advisors that build globally diversified portfolios automatically, or through AI-driven portfolio management and trading agents that dynamically adjust geographic exposure based on market conditions. These approaches trade a degree of control for convenience and systematic discipline, which for many investors is a worthwhile exchange.
No honest analysis of a market at all-time highs can skip the obvious question: after a 24% year-to-date run and a record-breaking surge, is it simply too late?
The bull case argues that the rally rests on real foundations rather than pure speculation. Corporate earnings have been genuinely strong, the governance reforms are structural and ongoing, the AI supply-chain demand is backed by actual capital expenditure, and even after the rally, many Japanese companies trade at valuation multiples that remain reasonable by global standards — a legacy of the decades during which the market was chronically cheap. From this view, Japan is a market that was undervalued for a long time and is still in the process of closing the gap.
The bear case argues for caution. Any market making record highs after a sharp run is more vulnerable to profit-taking, as the modest May 14 pullback already hinted. The rally is heavily tied to the global AI trade, which means a correction in US technology stocks — exactly the kind of scenario that prominent investors have warned about — would almost certainly drag Japan down with it, undermining part of the diversification rationale. And the yen remains a wildcard that could move sharply in either direction.
The honest synthesis is that both cases contain truth, and that the question "is it too expensive?" is the wrong question for a long-term diversifier. The right question is "what is the appropriate permanent allocation to international equities for my goals, and am I building toward it in a disciplined way?" An investor who answers that question properly does not need to time the Nikkei. They accumulate international exposure steadily, perhaps with extra discipline after sharp run-ups, and let the permanent allocation do its work across cycles. Whether any specific entry week is "too late" matters enormously to a trader and very little to a diversified long-term investor. Tools like the Sharpe ratio help an investor judge whether the return a market is offering actually compensates for its risk, which is a more useful lens than the binary "cheap or expensive."
A market that just posted the best returns in the world is a behavioral minefield. The same psychological patterns that damage investors in their home market are intensified when a foreign market is involved, because distance and unfamiliarity make it harder to think clearly.
Performance chasing is the most obvious danger. The instinct to pour money into Japan precisely because it just returned 24% is the instinct to buy high. The discipline is to size an international allocation based on its permanent role in the portfolio, not based on last quarter's leaderboard.
Recency bias convinces investors that whatever just happened will continue. Japan led in 2026; the brain extrapolates that Japan will lead in 2027. Market leadership rotates, and the duration of an outperformance streak is not evidence that it will continue.
Neglecting the currency is the trap specific to international investing. An investor who focuses entirely on the equity chart and ignores the yen has only analyzed half the trade. The currency decision must be conscious.
Home-market overconfidence in reverse — assuming a foreign market is riskier simply because it is foreign — leads investors to underweight international exposure permanently, which is itself the concentrated bet they were trying to avoid.
The antidote to all four is the same: a written plan with a deliberate target allocation, executed with discipline regardless of which market is hot. A deeper understanding of how emotions affect investment decisions and a properly developed long-term investor mindset are worth more here than any view on the Nikkei's next move. And because the right international allocation depends heavily on individual circumstances, it is worth honestly assessing what type of investor you actually are before settling on a number.
The Nikkei's record run reflects a combination of forces: Japan's deep position in the global AI semiconductor supply chain, multi-year corporate governance reforms that have improved shareholder returns, the economy's emergence from decades of deflation, and a period of yen weakness that has flattered exporter earnings. The explosive single-day gain on May 7, 2026, was amplified by timing — Japanese markets reopened after a holiday closure and priced in several sessions of global tech gains at once.
Among major global benchmarks, yes, through mid-May 2026. The Nikkei's year-to-date gain of roughly 24% placed it well ahead of the US S&P 500 at around 8.3% and Canada's TSX at around 7.7%, making it the standout performer among the world's large equity indices for the year so far.
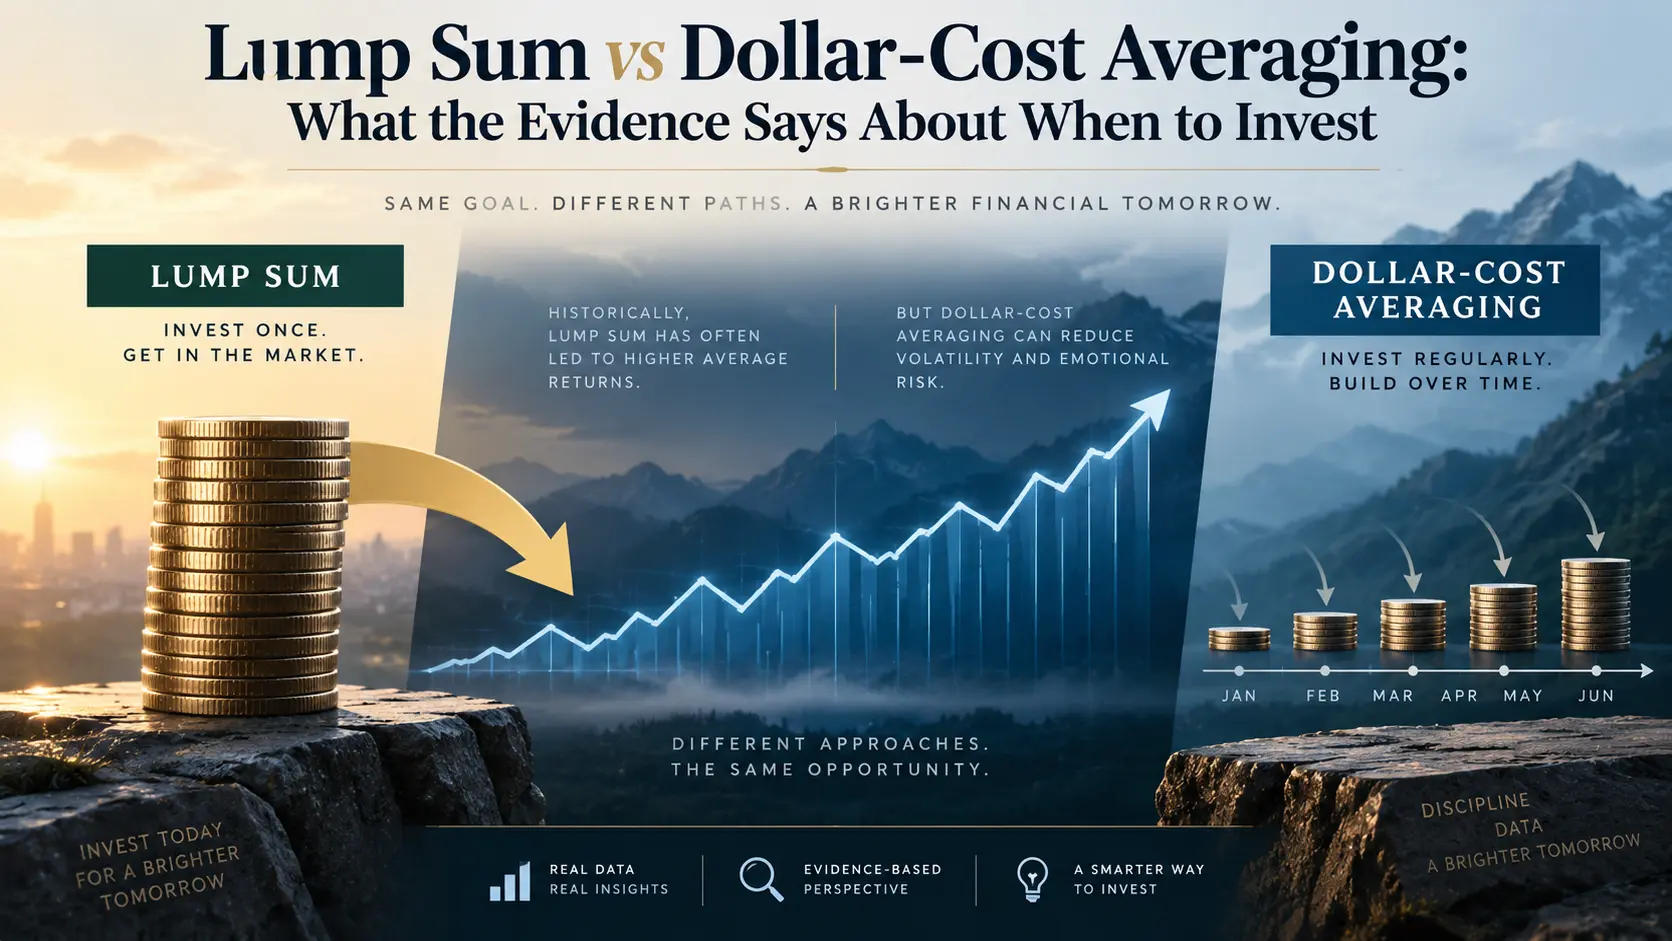
For a long-term investor building international diversification, the better framing is not whether to "time" the Nikkei but what permanent allocation to international equities suits your goals, and whether you are building toward it with discipline. All-time highs increase short-term vulnerability to profit-taking, so investors may choose to accumulate gradually rather than in a single lump sum. The decision should be driven by portfolio construction, not by recent performance.
The Japanese yen. As a foreign investor you are making two bets simultaneously — on the stocks and on the currency — and the currency leg can amplify or erase your equity returns. If the Nikkei rises but the yen weakens against your home currency by a similar amount, your converted return can be close to zero. This is why choosing between currency-hedged and unhedged exposure is the single most important decision when allocating to Japan.
A currency-hedged Japan ETF strips out yen movements, giving you something close to the pure equity return a local Japanese investor experiences — appropriate if you want Japanese stock exposure without a currency view, or expect the yen to weaken. An unhedged Japan ETF leaves you fully exposed to yen movements — appropriate if you want the currency diversification the yen can provide, or expect it to strengthen. Neither is universally better; what matters is choosing deliberately rather than by accident.
Very closely. Japanese companies are major suppliers of the semiconductor manufacturing equipment, chip-testing systems, and advanced materials that the global AI build-out depends on. When US AI and chip stocks rally on strong earnings, Japanese supply-chain names typically rally alongside them. This tight connection means Japan offers a different angle on the AI theme, but it also means a correction in US technology stocks would likely pull Japanese equities down too — an important caveat for the diversification argument.
There is no single correct number; it depends on your goals, time horizon, risk tolerance, and home market. The key principle is that a deliberate, permanent international allocation reduces the concentration risk of betting everything on one country. Many globally diversified frameworks hold a substantial minority of equity exposure outside the home market. The right figure for you should be set as part of an overall asset allocation plan and then maintained with disciplined rebalancing.
Key things to monitor include a sharp correction in global AI and technology stocks, which would likely drag Japan lower given the tight linkage; a rapid strengthening of the yen, which can pressure exporter earnings and the local index; signs of profit-taking after the record run, as briefly seen in mid-May; and shifts in Japanese monetary policy and interest rate expectations, which affect both equities and the currency. None of these is a reason to avoid Japan, but all are reasons to size the position sensibly and stay diversified.
The Nikkei 225's record-breaking 2026 is, on its surface, a story about Japan. But the more useful way for an investor to read it is as a story about the limits of any single market. The best-performing major equity index in the world this year has been one that most retail investors, anchored to their home market, do not own. That gap — between a roughly 24% return and a single-digit one — is the price of home bias, paid in full and in real money.
Japan's rally rests on genuine foundations: a structural position in the AI supply chain, real and ongoing corporate governance reform, and an economy that has finally broken free of its long deflationary trap. Those are durable forces. But the rally also carries real risks: a tight dependence on the global AI trade that undercuts part of its diversification value, a market at all-time highs that is more exposed to profit-taking, and the ever-present wildcard of the yen, which can quietly hand a foreign investor a very different return from the one the headline index suggests.
The right response to all of this is not to chase the Nikkei because it is hot, and it is not to ignore international markets because they are unfamiliar. It is to treat international diversification as a permanent, deliberate feature of a well-built portfolio — sized to your goals, conscious about currency, and executed with the behavioral discipline to stick to the plan whether Japan is leading the world or lagging it. Markets rotate. Leadership moves. The investor who owns several of the world's markets, in sensible proportion, never has to predict which one will be next.
If you want to build a globally diversified portfolio with deliberate international exposure, conscious currency management, and disciplined risk controls across every market regime, explore how AssetWhisper can transform your investment portfolio and discover the frameworks designed to capture opportunity wherever in the world it appears.
Related Reading on AssetWhisper:
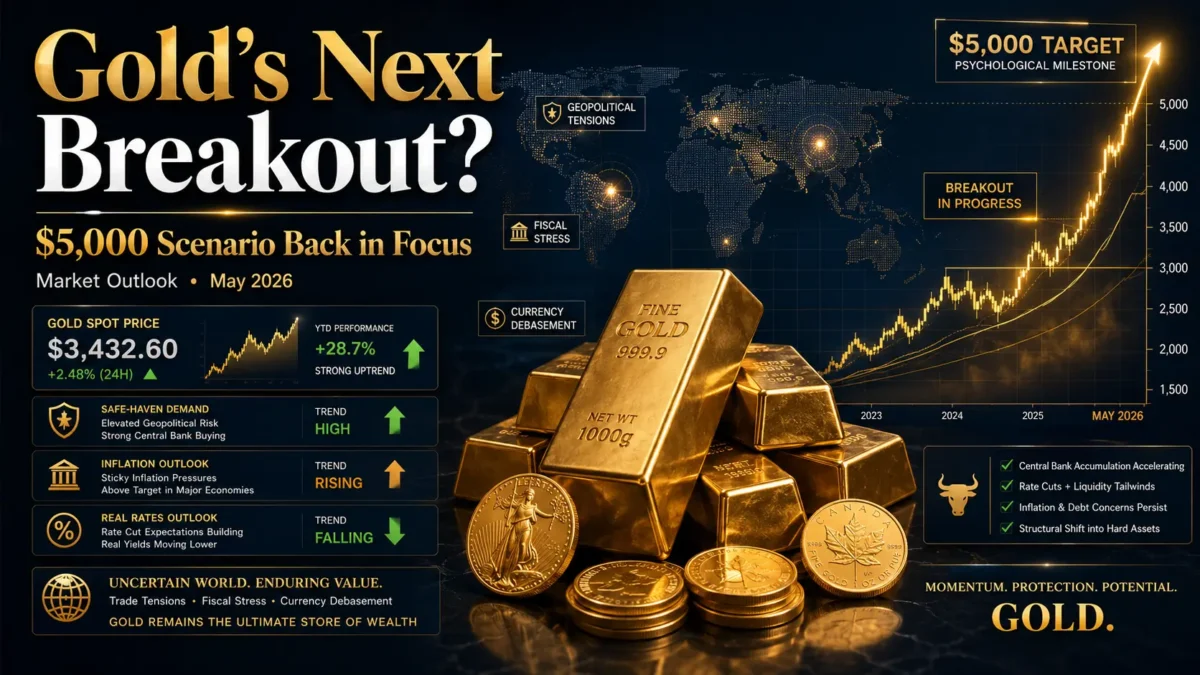
Few asset classes have lived a more dramatic 2026 than gold. The yellow metal hit an all-time high of roughly $5,595 per ounce on January 29, slid sharply once the US–Iran conflict erupted in late February, and is now climbing back above $4,720 as peace negotiations through Pakistani mediators raise hopes that the Strait of Hormuz will fully reopen. After more than a 10% drawdown from the January peak, traders, central banks, and long-term allocators are all asking the same question: was that the top of the cycle, or is the rally simply rebuilding for the next leg higher?
The major investment banks have already answered. J.P. Morgan Global Research now projects gold averaging $5,055 per ounce by the fourth quarter of 2026 and rising toward $5,400 by the end of 2027. Morgan Stanley has flagged a bull-case target of $5,700, while Societe Generale's most aggressive scenario reaches $6,000 before year-end. Those are not fringe forecasts. They reflect the consensus view that the structural forces driving gold higher — central bank accumulation, de-dollarization, persistent inflation pressure, and elevated geopolitical risk — have not weakened. They have merely been temporarily offset by the specific shock of the Hormuz conflict.
This article unpacks the full picture for serious investors: how the 2026 story has actually played out, what is driving gold beyond the headlines, where the major banks see prices heading, the practical vehicles available to gain exposure, and the portfolio-construction mistakes that quietly destroy returns even in winning markets.
Understanding where gold is heading requires understanding the path that brought it here, because the 2026 trajectory has compressed multiple full cycles into a single calendar year. Investors who only see today's price miss the story embedded in the journey.
Late 2025 set the stage. Gold ended December 2025 trading near $4,550 per ounce after a year that delivered approximately 55% in returns. The metal had crossed $4,000 for the first time in October 2025, propelled by tariff uncertainty, a softer US dollar, and aggressive central bank accumulation. The setup entering 2026 was already historic, with the metal having printed more than 50 all-time highs during 2025 alone.
January 2026 produced the peak. The momentum carried into the new year and accelerated. By January 29, gold had reached an intraday all-time high near $5,595 per ounce, driven by a combination of trade-policy threats, a renewed flight to safety, ongoing central bank purchases, and a weakening US dollar that made dollar-priced bullion more affordable for international buyers. Investor positioning in gold ETFs reached a historic peak of 4,025 tonnes during this stretch, with annual ETF inflows of roughly $89 billion in 2025 representing the largest year of inflows ever recorded.
February's war reset the tape. The conflict that erupted between the United States and Iran in late February disrupted what had been a near-vertical rally. Counterintuitively, gold fell sharply during the early phase of the war, dropping toward roughly $4,098 in early February before stabilizing. The reason was not that gold lost its safe-haven character. It was that the effective closure of the Strait of Hormuz drove a historic spike in oil prices, which fueled inflation expectations and forced markets to reprice the path of monetary policy. Higher yields and tighter expected real rates compete directly with non-yielding gold, and that competition mattered more in the short term than the obvious geopolitical fear bid.
April and early May brought the recovery. As peace negotiations progressed and the United States routed a one-page memorandum of understanding through Pakistani mediators aimed at reopening Hormuz, oil prices fell, inflation worries eased, and gold staged a recovery. By May 8, 2026, spot gold was trading around $4,715, posting a weekly gain of more than 2% and approaching technical resistance near $4,800. The metal remained down roughly 10% from the January peak, but the structural bid had clearly returned.
The lesson buried in this sequence is one of the most useful in commodity investing: gold does not respond to geopolitical risk in a straight line. It responds to the net effect of geopolitical risk on real interest rates, currency dynamics, and inflation expectations. That distinction is what separates investors who use gold strategically from those who chase headlines.
The full bull case for gold rests on three structural forces that operate independently of any specific war headline. Each has its own logic, its own data, and its own time horizon, and together they explain why so many institutions are looking through the recent volatility to forecasts in the $5,000–6,000 range by year-end.
The single most underappreciated driver of the modern gold market is sustained official-sector buying. Global central banks bought a net 244 tonnes of gold in the first quarter of 2026 alone, a figure that comfortably exceeds the five-year average. The People's Bank of China has now extended its purchasing streak past 17 consecutive months, and other emerging-market central banks — including those of India, Turkey, and several Gulf states — have continued to add to their reserves at a measured pace.
This is not speculative behavior. It is policy. Central banks accumulate gold to diversify reserves away from concentrated dollar exposure, to insulate their balance sheets from sanctions risk, and to anchor monetary credibility in a period when fiat currency volatility has become a strategic consideration. The math is straightforward: when a single category of buyer with effectively unlimited time horizons and policy mandates continues to absorb hundreds of tonnes per quarter, the floor under prices rises mechanically. Investors used to thinking of gold purely as a sentiment trade routinely underestimate this effect.
Looking forward, J.P. Morgan Global Research projects approximately 585 tonnes of quarterly investor and central bank demand on average through 2026, of which roughly 190 tonnes per quarter would come from central banks. Their rule of thumb — that every 100 tonnes of net quarterly demand above 350 tonnes corresponds to roughly a 2% sequential rise in gold prices — explains why their forecasts cluster in the $5,000-plus range.
The second force is more political than financial but no less powerful. Since the wave of Western sanctions following 2022, an increasing share of cross-border trade and reserve management has moved toward non-dollar settlement. That shift has not toppled the dollar and is unlikely to in any short time frame, but it has reduced the marginal demand for dollar-denominated reserve assets and increased the marginal demand for assets that do not depend on the goodwill of any specific government — most obviously gold.
Even partial de-dollarization carries large numerical implications when applied to global reserve pools measured in trillions. A central bank that shifts even a few percentage points of its reserve composition from Treasuries to gold can move the needle on multi-quarter demand. Combined with the bilateral payment arrangements that several emerging-market blocs have explored, this creates a slow-grinding structural tailwind that is largely indifferent to short-term US economic data.
This dynamic also intersects in interesting ways with the rise of central bank digital currencies and the broader debate about the future architecture of money. Investors who track only the equity market often miss how much of the global financial conversation in 2026 is actually about the unit of account itself.
The third force is the most directly intuitive. Gold has historically functioned as protection against currency debasement, inflation, and the slow-motion erosion of purchasing power that affects almost every saver. In 2026, despite the Federal Reserve holding rates at 3.50%–3.75%, inflation has not continued to descend toward the 2% target as smoothly as policymakers had hoped. Federal Reserve Bank of Chicago President Austan Goolsbee has publicly warned that inflation has reaccelerated since the outbreak of the Iran war, complicating the policy outlook.
For investors with cash exposure, the implication is sharp. The real return on bank deposits and short-duration Treasuries is much smaller than the headline interest rate suggests once inflation is properly accounted for. That dynamic is exactly the one explored in our analysis of why savings lose value and what to do about it, and it is the underlying reason that gold ETF inflows reached a record $89 billion in 2025. Investors are not buying gold to get rich. They are buying gold to stay rich. The distinction matters for sizing, time horizons, and behavioral expectations.
The interplay between gold and the Federal Reserve's policy path is also subtle. Lower nominal rates reduce the opportunity cost of holding non-yielding gold and tend to be supportive. Higher real rates — meaning nominal rates net of inflation — are the more direct competitor. This is exactly why understanding how interest rates shape investment choices is so essential before allocating to precious metals in any meaningful size.
Forecasts are not commitments, and even the most respected institutional research desks miss inflection points. But when several major banks converge on a directional view despite using different models, that convergence is a meaningful signal. The 2026 gold consensus has consolidated around three reference points.
J.P. Morgan Global Research's base case. The investment bank projects gold averaging approximately $5,055 per ounce by the fourth quarter of 2026, with a path toward $5,400 by the end of 2027. Their model leans heavily on the relationship between quarterly investor and central bank demand and prices, an empirical link they estimate explains roughly 70% of the quarter-over-quarter change in gold prices. With expected demand averaging around 585 tonnes per quarter through 2026, the model produces sustained upward pressure on prices.
Societe Generale's bull scenario. The French bank has highlighted a path toward $6,000 per ounce by year-end, framing it not as a stretch target but as a scenario with real probability if current macro conditions persist. Their thesis emphasizes the combination of geopolitical risk, fiscal pressure on developed-market sovereigns, and continued de-dollarization.
Morgan Stanley's bull case. The US investment bank's bull-case target sits at $5,700, suggesting the rally has additional room even from current elevated levels. Their analysis places particular weight on ETF flow momentum and the structural shift in retail investor allocation to precious metals.
The conservative perspective. Not every research team is bullish. Some analysts argue that gold has already discounted most of the macro risk and that a stabilization between $4,500 and $5,000 is more realistic, particularly if the US–Iran ceasefire holds and inflation begins to cool. Acknowledging the bear case is essential to honest portfolio construction. Investors who only consume bullish gold research will miss the conditions under which the metal underperforms.
The longer-term outlook stretches further. The World Gold Council has noted that gold achieved more than 50 all-time highs in 2025 and delivered total returns above 60%, framing 2026 as a continuation rather than a new beginning. The share of gold in total global financial assets has risen from historically depressed levels to approximately 2.8% in late 2025 — still well below the levels seen in prior gold cycles, suggesting allocation room remains.
The mechanical case for holding gold is built on a single empirical observation: gold has historically delivered low correlation with equities, and that correlation tends to fall further during equity drawdowns. In other words, the diversification benefit is structurally counter-cyclical. When you most need it, it works best.
This property is exactly what makes gold relevant for the type of investor profile we describe in our analysis of crisis-proof investments and resilient sectors during periods of volatility. It is also why gold features prominently in serious discussions of effective strategies for investment hedging. The metal is not a return engine in the way equities are over multi-decade horizons. It is a volatility absorber, a debasement hedge, and a portfolio insurance policy that becomes most valuable in exactly the scenarios that destroy equity-heavy allocations.
A useful lens is the difference between expected return and risk-adjusted return. Equity-only portfolios may have higher headline expected returns, but their risk-adjusted performance — the kind measured by metrics like the Sharpe ratio — typically improves when modest gold exposure is added. The improvement is not because gold beats stocks. It is because gold zigs when stocks zag, smoothing the journey enough to let investors stay invested through downturns that would otherwise trigger panic selling. For most retail investors, the real enemy of compound returns is not low expected return — it is behavioral failure during drawdowns.
Once an investor has decided that gold belongs in their allocation, the next question is structural: which vehicle? Each option carries a different combination of cost, convenience, counterparty risk, tax treatment, and exposure profile. The right choice depends on the size of the position, the holding period, and the investor's broader portfolio architecture.
Physical gold remains the purest expression of the asset. Investors hold actual bars or coins, either in personal custody or in allocated vaults provided by specialized custodians. The advantages are direct ownership, no counterparty risk in the form of an issuer, and full insulation from financial-system disruptions. The disadvantages are real: storage and insurance costs erode returns, secondary-market liquidity for small bars and coins comes with wider spreads, and authentication risk exists when buying outside reputable channels.
Bar and coin demand globally surpassed 1,200 tonnes in recent years, and it is on track to remain elevated in 2026. For investors with multi-decade horizons and a meaningful allocation, physical gold is often the cornerstone of a serious gold position. For smaller allocations or shorter horizons, the friction usually outweighs the benefits.
Gold-backed exchange-traded funds remain the workhorse of mainstream gold investing. They offer instant liquidity, low expense ratios, intraday tradability, and the operational simplicity of a brokerage account. The largest gold ETFs hold physical bullion in segregated vaults, with regular audits and transparent holdings reports. Global gold ETF assets under management doubled to a historic peak of approximately $559 billion through late 2025, and the inflow trend has continued in 2026.
The trade-off is the layer of trust required: investors are relying on the fund structure, the custodian, and the underlying audit framework. For most investors, that trust is well-placed and the operational efficiency is worth it. ETFs also fit cleanly into broader portfolio frameworks, including the kind of diversified asset allocation principles that good investors apply across their entire book.
Gold mining equities offer leveraged exposure to the gold price. When gold rises, miners' revenues rise faster than their costs, expanding margins disproportionately. The reverse is also true: a small move down in the gold price can compress margins severely. This leverage cuts both ways and makes mining equities a fundamentally different exposure than physical gold or bullion-backed ETFs.
Investors using mining stocks should treat them as equity investments with gold-correlated upside, not as gold substitutes. That distinction matters for position sizing, tax treatment, and risk management. Diversified miner ETFs reduce single-name risk relative to picking individual companies, which is generally the prudent path unless the investor has specific conviction backed by company-level analysis.
For sophisticated investors and active traders, futures contracts and derivatives provide capital-efficient gold exposure. Standard COMEX gold futures represent 100 troy ounces, and contract margin requirements allow exposure many times larger than the cash deposited. This leverage is powerful and dangerous in equal measure.
Derivative gold exposure is genuinely useful for hedging existing positions, expressing tactical views, and managing short-term portfolio adjustments. It is genuinely catastrophic when used as a leveraged buy-and-hold vehicle by investors who do not fully understand margin mechanics. Anyone considering this route should first build a foundation in risk management for financial investments and stress-test their position against multi-day adverse moves.
Several jurisdictions, including India, offer sovereign gold bonds — government-issued instruments that track the gold price while offering a small coupon. Newer digital-gold platforms allow investors to buy fractional grams of allocated gold through mobile applications. Both approaches lower the barrier to entry and reduce friction for small allocations. Investors should evaluate the issuer, the redemption mechanism, and the underlying allocation structure before committing capital, since the operational details vary widely across products.
The single most asked question in gold investing has no single answer, but the framework for thinking about it is clear. Three inputs determine the right allocation: the investor's overall risk profile, the existing composition of their portfolio, and their conviction about the macro regime.
A useful starting point used by many institutional allocators is 5% to 15% of total portfolio value in gold and gold-related assets. The lower end of that range is appropriate for investors with long horizons, high risk tolerance, and meaningful equity exposure that they expect to hold through cycles. The higher end is appropriate for investors who place greater weight on capital preservation, who hold significant fixed-income exposure they expect to be eroded by inflation, or who are explicitly positioning for a macro regime characterized by elevated geopolitical and currency risk.
Conducting an honest assessment of what type of investor you actually are is the indispensable first step before deciding on any allocation number. Many investors discover, after honest reflection, that their stated risk tolerance is meaningfully different from their behavioral risk tolerance — meaning the level of drawdown they can tolerate without making destructive decisions. Gold allocation should be sized to keep the overall portfolio within that behavioral comfort zone, not just within a theoretical efficient-frontier optimum.
Even investors who get the macro thesis right can damage their results through avoidable execution errors. Five mistakes are especially common in 2026 conditions.
Concentration in a single vehicle without understanding what it actually is. Holding mining stocks and assuming they behave like physical gold is the most common version of this error. The correlation is real but the volatility profile is completely different. Position sizing should be calibrated to the actual instrument, not to a vague "gold exposure" label.
Chasing performance after major rallies. Buying gold at $5,500 in late January 2026 because momentum looked unstoppable, then panic-selling at $4,200 a month later when the war shock hit, is a textbook destroyer of returns. The behavioral pattern repeats in every asset class. Understanding how emotions affect investment decisions is the antidote, and it costs nothing to apply.
Treating gold as a get-rich-quick trade. Gold is a long-duration, low-velocity insurance asset. Investors who expect it to behave like a high-conviction equity name will be disappointed by stretches of sideways action and tempted to sell at the worst moments. The correct mental model treats gold the way a homeowner treats fire insurance: necessary, occasionally invisible, occasionally indispensable, never the central source of wealth.
Ignoring tax structure. Different gold vehicles carry different tax treatments depending on jurisdiction, holding period, and investor classification. Physical gold may be taxed as a collectible at higher rates in some countries, while certain gold ETFs may receive more favorable treatment. Sovereign gold bonds often carry specific tax incentives. The right structure can preserve a meaningful share of returns over a multi-year holding period.
Mistaking gold for a substitute for diversified equity exposure. Even strong gold cycles do not make gold an alternative to a diversified equity portfolio for long-term wealth compounding. Equities have historically delivered far higher long-term real returns. Gold complements equity exposure by reducing portfolio volatility; it does not replace it. The same broader principle applies when investors look at other defensive instruments, including dividend-paying equities and REITs.
Gold is not the only safe-haven candidate available to investors, and understanding how it compares to alternatives sharpens allocation decisions.
US Treasuries offer guaranteed nominal cash flows and remain the deepest, most liquid safe-haven market in the world. Their weakness in 2026 is precisely that the inflation they aim to protect against has not been fully tamed, meaning real returns can be uncomfortably thin. Treasuries excel as crisis hedges in deflationary scenarios; gold excels in inflationary or currency-debasement scenarios.
The Japanese yen and Swiss franc have historically appreciated during global risk-off episodes, providing currency-based diversification. Their effectiveness in 2026 has been mixed, with the yen's behavior particularly distorted by Bank of Japan policy and reported intervention activity.
Bitcoin and cryptocurrency have been promoted as digital gold by their advocates. Their behavior during the actual crisis episodes of 2026 has been more correlated with risk assets than with traditional safe havens, calling the substitution thesis into question for now. Crypto may eventually develop a more independent risk profile, but the historical record does not yet support treating it as a gold replacement in serious portfolio construction.
Defensive equity sectors — utilities, consumer staples, and healthcare — provide a partial substitute for gold's defensive function while maintaining the long-term return characteristics of equities. This approach pairs naturally with the sectoral framework discussed in our overview of crisis-proof investments and resilient sectors.
The honest answer is that no single safe haven dominates across all scenarios. The right approach is layered: a core allocation to gold for inflation and currency-risk hedging, a complementary allocation to high-quality fixed income for deflation protection, and defensive equity sleeves for the portion of the portfolio that needs to maintain long-term return potential.
The intuitive expectation is that war pushes gold higher, and over long enough horizons that is generally true. In the specific case of the early 2026 Iran conflict, however, the closure of the Strait of Hormuz drove a historic surge in oil prices, which reignited inflation concerns, lifted bond yields, and raised expectations that central banks would need to keep policy restrictive for longer. Higher real rates compete directly with non-yielding gold, and that effect overwhelmed the geopolitical bid in the short term. As the ceasefire took hold and oil prices fell, the inflation pressure eased and gold resumed its uptrend.
Whether any specific entry price is "too late" depends on the investor's time horizon, the alternative uses of that capital, and the size of the intended position. Major investment banks see meaningful upside from current levels: J.P. Morgan's $5,055 average for Q4 2026 implies roughly 7% upside; Morgan Stanley's bull case at $5,700 implies more than 20%; Societe Generale's $6,000 scenario implies more than 25%. Investors with multi-year horizons and modest allocation targets typically find the current level acceptable for staged accumulation rather than for lump-sum positioning at the top of a short-term move.
The price exposure is broadly equivalent for physical bullion and physical-gold-backed ETFs over reasonable holding periods. The differences come from cost structure (storage and insurance for physical versus expense ratio for ETFs), liquidity (instant for ETFs, days to weeks for physical), tax treatment (varies by jurisdiction), and counterparty risk (theoretically zero for personally held physical, low but non-zero for well-structured ETFs). For most investors with sub-$100,000 allocations, ETFs offer better total economics. For very large or very long-horizon allocations, physical may be worth the operational overhead.
The opposite, actually. Sustained central bank buying provides a structural floor under prices and is one of the most reliable demand sources in the gold market. The reason central banks buy gold — to diversify reserves, reduce concentration risk, and anchor monetary credibility — is precisely the reason individual investors might consider holding it. Following intelligent buyers with policy mandates and infinite holding periods is generally a sound strategy.
Gold's recession performance depends heavily on the type of recession. During inflationary or stagflationary recessions, gold has historically performed strongly. During deflationary recessions, the metal can struggle relative to high-quality fixed income, which benefits from falling yields. The 2026 environment is closer to a stagflation scenario, with persistent inflation pressure and slowing growth in some segments, which is broadly supportive for gold even if a formal recession arrives.
In many jurisdictions, yes. Self-directed retirement accounts and similar structures allow allocation to physical gold or gold ETFs subject to specific rules about custody, eligible products, and reporting. The exact rules vary widely by country and account type, so consulting a qualified tax advisor is essential before making this kind of allocation decision.
Three scenarios would seriously challenge the thesis. First, a durable resolution of geopolitical tensions combined with a sharp disinflation toward central bank targets would reduce both the safe-haven and the inflation-hedge bid. Second, a coordinated tightening of monetary policy that pushed real rates significantly higher would increase the opportunity cost of holding gold. Third, a meaningful slowdown in central bank buying, particularly from China, would remove the structural demand floor. None of these scenarios looks imminent, but all three are worth monitoring as part of an honest framework for identifying when to take profits on undervalued or overvalued assets.
The textbook answer is that gold typically reduces portfolio volatility without proportionally reducing expected returns, because of its low correlation with both equities and bonds. The right way to verify this for your specific situation is to model the proposed allocation across multiple historical regimes — bull markets, bear markets, inflationary spikes, and deflationary shocks — and confirm that the resulting risk-adjusted return matches your goals. This kind of analysis is exactly what differentiates an intentional investor mindset from a reactive one.
Few asset classes demand the patience that gold does. The metal can spend years consolidating after major rallies, frustrate investors who expect equity-like returns, and then deliver outsized performance in exactly the periods when other assets are struggling. The 2026 story to date — record peak in January, sharp drawdown during the Iran war, ongoing recovery through the spring — is a compressed reminder that gold's real value lies in the journey rather than any single price print.
The structural case for continued gold strength through the rest of 2026 and into 2027 rests on three independent forces: continued central bank accumulation at historically elevated levels, the slow grind of de-dollarization in global reserves and trade settlement, and persistent inflation pressure that has not yet fully receded. Major investment bank forecasts in the $5,000–6,000 range reflect the consensus that these forces are not exhausted. They have simply been temporarily masked by the specific shock of the Hormuz disruption.
The most important takeaway, however, is not the price target. It is the framing. Gold deserves a place in serious portfolios not because it will go up — although the probability of that is high in the current regime — but because it provides protection that is hard to replicate with any other asset class. The investors who will benefit most from the continued gold cycle are those who size their positions correctly, choose vehicles that match their horizon and operational capacity, and resist the behavioral temptations that destroy returns in every asset class but especially in commodities.
If you are ready to bring institutional discipline to how you allocate to gold and other safe-haven assets, learn how AssetWhisper can transform your investment portfolio with data-driven frameworks for diversification, risk management, and long-term compounding across every market regime.
Related Reading on AssetWhisper:
If 2024 was the year retail investors discovered AI-powered ETFs, and 2025 was the year quant funds quietly rebuilt their stacks around large language models, then 2026 is the year AI trading agents stop being a research curiosity and start moving real capital at scale.
A trading agent is not a script that buys when RSI drops below 30. It is software that perceives the market, reasons about it, plans actions, executes trades, and learns from outcomes — closing the full loop that human portfolio managers used to monopolize. The line between "tool" and "trader" is blurring fast, and understanding where it lands will define who wins and who lags this cycle.
This guide is the natural continuation of our deep dive on Artificial Intelligence ETFs and our reference piece on Algorithmic Trading Strategies for 2026. If AI ETFs are how you invest in artificial intelligence, AI trading agents are how artificial intelligence invests for you. Two very different propositions — and you need to understand both.
By the end of this article you will know what AI trading agents really are, how they differ from the trading bots you have probably already met, the architectures powering them in 2026, the realistic risks behind the hype, and a practical roadmap for using them in your own portfolio.
An AI trading agent is an autonomous software system that makes investment decisions by combining machine learning models, real-time market data, and goal-oriented reasoning. Unlike a traditional trading bot, an agent does not just execute predefined rules — it interprets context, weighs alternatives, and adapts its behavior to changing market regimes.
A useful working definition: an AI trading agent is a system with perception, memory, reasoning, and action, deployed against a financial objective.
The shift from "bot" to "agent" matters because it changes what humans need to specify. With a bot, you write the rules and the bot follows them. With an agent, you specify the goal and the constraints — for example, "maximize risk-adjusted returns on US tech equities, max 15% drawdown, no leverage above 1.5x" — and the agent figures out how.
This is one of the most common confusions among retail investors, so let's settle it cleanly.
| Dimension | AI ETF | AI Trading Agent |
|---|---|---|
| What you own | A basket of AI-related companies | Nothing — the agent operates an account on your behalf |
| Who decides | The fund manager (often passively tracks an index) | The AI itself, within constraints you set |
| Time horizon | Months to years | Seconds to weeks |
| Customization | None — one product fits all | Fully customized per portfolio |
| Cost structure | Expense ratio (0.30%–0.75%) | Subscription, performance fee, or self-hosted |
| Transparency | Holdings disclosed daily | Decisions can be opaque without explainability tooling |
Put simply: AI ETFs give you exposure to the AI theme. AI trading agents give you exposure to AI as a portfolio manager. They serve different goals and can — and often should — coexist in a single portfolio.
Classical algorithmic bots are deterministic. Given the same input, they produce the same output. They excel at rule execution but fail when the rule itself becomes obsolete — which happens whenever market structure, volatility regime, or correlation behavior changes.
AI trading agents are probabilistic and adaptive. They generate distributions over actions, not a single deterministic output, and they update their internal model as new data arrives. The trade-off is that they are harder to debug, harder to audit, and harder to trust on day one. A serious operator therefore treats agents as junior analysts who need supervision, not as oracles.
Most production-grade agents in 2026 share a five-layer architecture. Understanding this stack is the difference between evaluating a serious product and falling for marketing copy.
The agent is only as good as the data flowing into it. Modern stacks combine:
Streaming pipelines (Kafka, Redpanda, or cloud-native equivalents) deliver this data with sub-second latency, while vector databases store embeddings of textual data so the agent can retrieve relevant historical context on demand.
Raw data is transformed into features the model can reason over: volatility cones, factor exposures, sentiment scores, macro regime indicators, liquidity metrics. In 2026, much of this is automated by feature stores that version features, monitor for drift, and serve them with point-in-time correctness — which matters enormously for any backtest you trust.
This is where the architectural choices diverge most. Three patterns dominate:
Reinforcement learning (RL) policies — The agent learns a mapping from market state to action by trial-and-error in a simulated environment. PPO, SAC, and more recently distributional RL methods are the workhorses here. RL agents can discover non-obvious strategies but are fragile under regime change.
LLM-based reasoning agents — A large language model is given access to tools (data queries, calculators, broker APIs) and asked to plan trades that satisfy stated objectives. The LLM produces explicit chain-of-thought traces, which makes auditing dramatically easier. The risk is hallucination and over-confidence on data the model never actually retrieved.
Hybrid quant–AI systems — Classical statistical models generate signals; the AI layer arbitrates between them, sizes positions, and handles the edge cases. This is where most institutional money sits in 2026 because it preserves the rigor of quantitative finance while gaining the flexibility of AI.
A signal is not a trade. Between "the model thinks AAPL goes up" and an actual fill, the agent must:
Mature agents treat the risk layer as a non-negotiable veto on the model's enthusiasm. This is the same discipline we explore in How to Manage Risk in Your Financial Investments — applied here as code, not a checklist.
After each trade, the agent records outcomes, attributes performance to specific decisions, and updates its understanding. The best systems separate learning from execution — production agents do not retrain on live data because that creates feedback loops that destroy performance during stress events. Instead, they log everything, retrain offline on validated data, and promote new model versions through a staged rollout.
Not all agents are built the same. Here are the main categories and what they are good for.
These agents learn policies through millions of simulated episodes. They shine in high-frequency contexts — market making, optimal execution, statistical arbitrage — where the action space is small and the reward signal is dense. They struggle with regime change and are notoriously hard to interpret. If a vendor sells you "RL-powered trading" without explaining their simulator, walk away.
These agents wrap an LLM around tools and prompts. They are particularly strong at research-driven trading — synthesizing earnings calls, comparing companies, drafting macro views, detecting narrative shifts. They are weak at low-latency execution and at any task that requires precise numerical reasoning without tool support. Their killer feature is explainability: every decision comes with a written justification.
Instead of one monolithic agent, multiple specialized agents collaborate. A researcher agent forms hypotheses, a quant agent backtests them, a risk agent stress-tests the portfolio, and a portfolio manager agent integrates the outputs. This mirrors how real hedge funds are organized and is becoming the dominant pattern for serious AI-driven funds in 2026.
These are specialized agents that monitor news, social media, and filings to detect narrative shifts — the moment when "AI is overhyped" becomes the consensus view, or when a regulatory rumor begins to harden into policy. They rarely trade alone; instead, they feed signals into broader systems.
The retail-facing category that is exploding in 2026. These agents take a user's goals, constraints, and risk tolerance, and run a full personalized portfolio — choosing assets, rebalancing, harvesting tax losses, and hedging tail risk. The frontier here is making them work well for accounts under $100,000, where execution costs would otherwise eat the alpha.
The capability jump in 2026 did not come from a single breakthrough. It came from five technologies maturing simultaneously.
Large language models with reliable tool use. Modern LLMs can be trusted to call APIs, parse responses, and chain reasoning steps without going off the rails — assuming the tools are well-designed. This is what made LLM agents go from demo to production.
Reinforcement learning at scale. Distributed simulators now let researchers train agents on the equivalent of decades of market data in days. Curriculum learning — where the agent first masters easy regimes before being exposed to crises — has dramatically improved robustness.
Vector databases and retrieval-augmented generation (RAG). Instead of stuffing all knowledge into the model's weights, agents retrieve relevant context (past trades, similar market regimes, prior research) and reason over it. This makes them far more sample-efficient and far easier to update.
Real-time data infrastructure. Sub-millisecond ingestion pipelines, time-series databases optimized for financial data, and feature stores with point-in-time correctness have removed the data-engineering bottleneck that held back smaller players for years.
On-chain analytics for crypto markets. Agents that trade digital assets now have access to wallet-level data, DEX flows, and protocol metrics that would have been unimaginable to the equity quants of a decade ago. This is part of what we discussed in Emerging Technologies in Financial Trading.
Theory is cheap. Here is where AI agents are actually creating value in 2026.
Long-short equity strategies are a natural fit. An agent can ingest hundreds of earnings transcripts per quarter, extract guidance changes, cross-reference them against historical reactions, and build a ranked book of longs and shorts. The work that used to require a team of sector analysts is now done by a multi-agent system in hours, not weeks.
Crypto markets are open 24/7, fragmented across dozens of venues, and rich in alternative data — exactly the environment agents thrive in. AI agents now handle the bulk of cross-exchange arbitrage, liquidity provision in DeFi pools, and narrative-driven momentum trades. The risk: crypto regimes change faster than any other asset class, so agent retraining cycles must be unusually aggressive.
FX markets reward agents that can rapidly integrate macro news, central bank communications, and positioning data. LLM-based agents are particularly effective at parsing FOMC statements and ECB press conferences in real time and translating tone changes into directional bets, with classical risk models keeping position sizes sane.
For long-term investors, the agent's job is not to time markets but to keep the portfolio on track — rebalancing back to target weights, harvesting tax losses opportunistically, and rolling positions efficiently. This is the most underrated use case because it works for everyone, not just sophisticated traders. It complements the strategies we cover in The Advantages of Dividend Investing and How to Invest in the Financial Market the Right Way.
When a CEO resigns, an FDA decision drops, or a geopolitical event hits the wires, agents can react in seconds — often parsing the source document, identifying second-order effects, and adjusting positions before human traders have finished reading the headline.
Speed and scale are the obvious advantages, but the more interesting ones are subtle.
Emotion-free execution. One of the largest sources of underperformance for retail investors is behavioral — panic selling, FOMO buying, anchoring on entry prices. Agents simply do not feel any of this. We dedicated a full article to why this matters in Behavioral Finance: How Emotions Affect Investment Decisions, and AI agents are the most direct technological answer to those biases.
Pattern recognition at scale. Agents can monitor thousands of instruments simultaneously and detect cross-asset relationships that would never be visible to a human watching three screens.
Continuous operation. Markets that never close — crypto, FX — were always poorly served by human teams. Agents work 168 hours a week without degraded performance.
Adaptive learning. When configured correctly, agents update their understanding of market regimes faster than any committee-driven investment process can.
Discipline by construction. A well-designed agent cannot violate its risk limits — they are enforced as code, not as a memo from the chief risk officer.
Anyone selling you AI trading agents without spending equal time on the risks is selling you something else.
The black box problem. Some architectures — especially deep RL — produce decisions that are genuinely hard to explain. When the agent loses 8% in a week, "the neural network thought it was a good idea" is not an acceptable post-mortem. Demand explainability tooling.
Overfitting and backtest illusion. Modern agents have so many parameters and so much expressive power that they can fit any historical dataset perfectly while generalizing terribly. A pristine backtest with a Sharpe ratio of 4.0 is more often a sign of leakage than of genius. We unpack this in The Sharpe Ratio: Its History, Applications, and Calculations.
Tail-risk blindness. Agents trained on the last decade have not seen a 2008-style credit freeze, a 2020-style pandemic crash, or a 1998-style hedge-fund unwind in their training data with the right intensity. Stress testing against synthetic scenarios is non-negotiable.
Concentration risk in the technology stack. If thousands of agents are trained on similar data, use similar architectures, and react to similar signals, they will sell at the same time. The "quant quake" of August 2007 is the canonical warning. AI agents arguably make this risk worse, not better.
Regulatory uncertainty. In 2026, regulators are still catching up with autonomous trading systems. Expect rules around explainability, accountability for AI-driven losses, and possibly capital surcharges to evolve significantly over the next few years.
Operational and infrastructure risk. A flawed deployment, a stale data feed, a misconfigured rate limit — any of these can cause an agent to generate catastrophic losses in minutes. Production discipline matters more here than in almost any other software domain.
This is the same lens we apply in Common Mistakes in Stock Market Investing: smart tools amplify both good and bad decisions, and an undisciplined operator with an AI agent is more dangerous, not less.
Your starting point depends on your experience, capital, and time commitment. Here is an honest roadmap.
Do not start by buying an "AI trading agent" subscription. Start by understanding what they do and how they fit your goals. A reasonable sequence:
The biggest beginner mistake is treating an AI agent as a magic money button. It is not. It is a tool whose behavior you must understand before sizing up.
You probably already run some combination of ETFs, dividend stocks, and tactical positions. AI agents fit naturally as a way to systematize parts of your process — the parts that are repetitive, emotion-prone, or too data-heavy to do well manually.
Start by automating one specific job: tax-loss harvesting, sector rotation based on macro indicators, or rebalancing across asset classes. Validate that the agent does that one job better than you did, then expand.
You have three paths:
Most readers should default to "buy" and consider "build" only after they have run a managed product for at least one full market cycle and understand exactly what they want to do differently.
The next 24 months are going to compress more change than the previous decade. Three trajectories are worth watching closely.
Agentic finance. Beyond trading, agents are starting to handle the full investment workflow — tax planning, estate considerations, cash management, debt optimization. The endpoint is a personal CFO that lives in your phone and coordinates a network of specialized agents.
DeFi-native agents. As decentralized finance matures, agents that can read smart contracts, evaluate protocol risk, and operate in fully on-chain environments will unlock yields and strategies that are simply unreachable through traditional brokerage rails.
Multi-modal agents. Today's agents are mostly text and numbers. Tomorrow's will read charts, watch earnings call video, listen to podcasts, and integrate that with structured data. This is closer than most people realize.
Personalization at scale. The shift from "one strategy for all clients" to "one strategy per client, tuned weekly to their specific goals and tax situation" is the big retail unlock. It only becomes economic with AI agents — which is exactly what we are building toward at AssetWhisper.
Every framework in this article is something we have built, broken, and rebuilt internally. AssetWhisper's research stack runs a multi-agent system that ingests market data, fundamental filings, sentiment, and macro indicators, then synthesizes them into the weekly market reports and trading ideas you receive on the platform.
We do not believe in opaque magic. Every signal we publish is traceable to specific data, specific reasoning, and specific risk controls. That philosophy — explainable AI applied to real markets — is the core of what makes AssetWhisper a different kind of investment platform.
If you want to see what AI trading agents can do without writing a line of code, that is the place to start.
Some are, many are not. Profitability depends on the underlying strategy, the quality of data, the risk discipline, and the execution costs. Treat any product claiming consistent double-digit monthly returns with extreme skepticism — those numbers are almost always either curve-fit, leverage-juiced, or fabricated.
No. Managed products and platforms like AssetWhisper expose AI-driven analysis through normal user interfaces. Coding is required only if you want to build your own agents or customize them deeply.
Yes, in most jurisdictions, with the standard caveats: you must be appropriately licensed if you offer agent-driven trading as a service, you must comply with market abuse rules, and you remain responsible for trades executed in your name. Regulatory scrutiny is rising, so expect more disclosure requirements over time.
Copy trading mirrors the trades of a human trader. AI trading agents make their own decisions based on models and data. They can be combined — for example, an agent that copies a base strategy while applying its own risk overlay — but the underlying mechanism is fundamentally different.
For narrow, well-defined tasks — execution, rebalancing, tax optimization — they already outperform humans. For broader judgment, scenario planning, and client relationships, humans still dominate. The realistic future is augmentation: agents handle the work that scales poorly with humans, humans handle the work that scales poorly with machines.
It varies. Robo-advisors with AI components start at $1–$500. Standalone AI trading agent products typically require $5,000–$25,000 for the economics to work. Self-built systems become viable around $50,000+, mostly because of execution and infrastructure costs.
AI trading agents are not a fad. They are the natural endpoint of three decades of automation in finance, accelerated by a generational leap in machine intelligence. By 2030, asking whether you "use AI agents" in your investing will sound like asking whether you use the internet to read research.
The winners in this transition will not be the investors who use the most aggressive agents. They will be the ones who understand exactly what their agents are doing, supervise them with discipline, and integrate them into a coherent strategy aligned with their goals. The technology is powerful. The judgment around it is what compounds.
Start small, demand explainability, respect tail risk, and let the agents handle what they are best at while you focus on the decisions only you can make. That is the real edge in 2026 — and the edge that AssetWhisper is built to give you.
Want personalized AI-driven analysis applied to your portfolio? Discover how AssetWhisper transforms your investment process and start putting agentic finance to work today.
Algorithmic trading is no longer a niche reserved for hedge funds and Wall Street quants. In 2026, automated systems account for roughly 70–80% of all equity volume in major markets, and a growing share of retail investors are discovering that the same tools used by institutional desks are now within reach. Cheaper compute, open-source libraries, accessible market data APIs, and AI models that can process unstructured information at scale have fundamentally changed who can build a quantitative edge — and how.
This guide is a complete, practical roadmap to algorithmic trading strategies for the modern investor. Whether you are a curious beginner who has heard the term "algo trading" in passing, or an intermediate trader ready to move from discretionary decisions to systematic execution, you will find a clear path forward. We will cover the core strategy families that work in 2026, the role artificial intelligence and machine learning now play, how to build and validate your first system, the risks nobody warns you about, and the tools that make the entire workflow possible.
By the end of this article you will understand why algorithms outperform human reflexes in specific contexts, which strategies fit which market regimes, and how to begin without losing money to the most common rookie mistakes. Let's begin.
Algorithmic trading — also called algo trading, automated trading, or systematic trading — is the use of computer programs to execute trades according to a predefined set of rules. Those rules can be as simple as "buy when the 50-day moving average crosses above the 200-day" or as sophisticated as a deep neural network trained on satellite imagery, earnings call transcripts, and order-book microstructure.
The defining characteristic is not complexity, but codification: every entry, exit, position-sizing, and risk decision is written in code, tested on historical data, and executed without emotional interference. This is the single biggest reason quantitative approaches have endured — they remove the cognitive biases that destroy most discretionary traders. If you have ever read about how emotions affect investment decisions, you already know how costly panic-selling and FOMO-buying can be. Algorithms do not panic.
These two terms are often confused. High-frequency trading (HFT) is a subset of algo trading characterized by holding periods measured in milliseconds, co-located servers next to exchange matching engines, and capital-intensive infrastructure. HFT is largely out of reach for retail traders — and that is fine.
The strategies in this guide focus on holding periods from minutes to weeks, which is where the vast majority of profitable retail and small-fund algorithms operate. You do not need a microwave tower in New Jersey to generate alpha; you need a coherent thesis, clean data, and disciplined execution.
Three structural shifts have converged in recent years to make this the most accessible moment in the history of systematic trading:
Large language models and time-series transformers can now ingest earnings transcripts, news flow, regulatory filings, and analyst reports and produce structured signals — sentiment scores, event extractions, topic clusters — that would have required entire NLP teams to build five years ago. A single developer with an API key can replicate research workflows that used to cost millions.
Real-time WebSocket feeds, REST endpoints for fundamentals, alternative datasets (credit-card transactions, web traffic, shipping manifests) — all of this is now available through commercial APIs at price points compatible with retail budgets. AssetWhisper itself is built on this foundation, exposing real-time price streams and analytics through a unified interface so traders can prototype without wrestling with infrastructure.
Cloud GPUs, serverless functions, and managed databases mean a strategy that needs to backtest across 5,000 tickers and 20 years of minute data can run in hours rather than weeks. The friction between "I have an idea" and "I have evidence the idea works" has collapsed.
The implication is straightforward: the edge no longer comes from access to tools or data. It comes from research process discipline — asking better questions, designing more honest experiments, and refusing to deploy strategies that do not survive rigorous validation.
Before we dive into specific strategies, it helps to understand the anatomy of a complete trading system. Every production-grade algorithm — whether retail or institutional — contains the same five layers.
Clean, point-in-time historical data plus reliable real-time feeds. Garbage in, garbage out has never been truer than in quantitative trading. Survivorship bias (only including companies that still exist), look-ahead bias (using information not available at the decision time), and inconsistent corporate-action adjustments are the silent killers of backtested strategies.
This is where your thesis lives — the logic that converts raw data into a directional opinion. A signal might say "this stock is overbought relative to its sector," or "earnings sentiment has flipped positive in the last three transcripts." Signals can be technical, fundamental, sentiment-based, or a blend.
Given a basket of signals, how do you size positions? Equal weight, signal-strength weighted, volatility-targeted, risk-parity, mean-variance optimized — each choice has tradeoffs. Position sizing is often more important than signal quality, a counterintuitive truth that most beginners ignore for too long.
Translating target positions into actual market orders without bleeding alpha to slippage, market impact, and fees. Limit orders, VWAP slicing, smart routing, and execution timing all matter, especially as your capital grows.
Pre-trade checks (max position, max gross exposure), real-time monitoring (drawdown alerts, P&L attribution), and post-trade diagnostics. This is the layer that keeps you in the game when something — and something always does — goes wrong.
The strategies below have stood the test of time, but each has been refined and combined with modern AI techniques in ways that make 2026 implementations very different from textbook versions. We will walk through how each works, when it tends to perform, and what to watch out for.
Core idea: instruments that have been moving up tend to keep moving up; those moving down tend to keep moving down — until they don't. Trend-following systems try to ride the meat of a move and exit when momentum fades.
Typical signals: moving average crossovers, breakouts from N-day highs, Donchian channels, ADX-filtered momentum, time-series momentum across asset classes.
When it works: in markets with strong directional regimes — commodity bull runs, currency devaluations, secular equity uptrends. Historically, trend strategies have shined precisely during market crises (2008, 2020), making them a valuable diversifier alongside long-only equity exposure. We covered the related concept of resilient investments during volatility in a previous article.
What to watch for: long stretches of choppy, range-bound markets where trend systems get whipsawed. Position sizing and multi-asset diversification are essential.
Core idea: prices oscillate around a fundamental value; extreme deviations tend to revert. The opposite philosophy of trend-following.
Typical signals: Bollinger Band reversions, RSI oversold/overbought, z-score-based pairs trading, statistical arbitrage on cointegrated baskets.
When it works: in stable, range-bound conditions and on pairs of assets that share a strong economic relationship (two refiners, two regional banks, an ETF and its constituents).
What to watch for: structural breaks. The classic mean-reversion failure is "the relationship was stable for ten years, until it wasn't." Companies merge, regulations change, business models diverge. A relationship that has cointegrated historically can — and eventually will — break, and your stop-loss must survive that day.
Core idea: a more rigorous flavor of mean reversion. Identify pairs (or larger baskets) of securities whose price spread is statistically stationary, then bet that any divergence in the spread will revert.
Typical implementation: rolling cointegration tests (Engle-Granger, Johansen), Kalman filters to estimate dynamic hedge ratios, and entry/exit thresholds expressed in standard deviations of the spread.
2026 evolution: machine-learning models now select candidate pairs from thousands of possibilities by clustering on fundamental and technical features, dramatically expanding the search space beyond intuition-driven pairs.
Core idea: at any moment, rank a universe of stocks by recent return (typically 3–12 months, skipping the last month to avoid short-term reversal), buy the top decile, and short — or simply avoid — the bottom decile. Rebalance monthly.
Why it persists: the momentum factor is one of the most documented anomalies in finance. It survives across decades, countries, and asset classes, although it suffers brutal drawdowns during sudden market reversals (notably 2009 and parts of 2023).
2026 enhancement: combining price momentum with earnings-revision momentum, analyst-sentiment momentum, and alternative-data momentum produces composite rankings that are more stable than any single signal alone.
This is the broadest and most rapidly evolving category. Instead of hand-coded rules, an ML model learns the mapping from features to expected returns directly from data.
Common approaches:
The hardest part: avoiding overfitting. Financial signal-to-noise ratios are notoriously low, and a complex model can find patterns in pure noise. Robust cross-validation, walk-forward analysis, and a healthy respect for parsimony separate practitioners from hobbyists.
Core idea: price reflects expectations; expectations shift in response to information; capture that information before it is fully priced.
News sentiment, social-media velocity, app-download trends, credit-card panel data, satellite imagery of retail parking lots and oil-storage facilities — all of these are now common inputs to systematic strategies. The 2026 edge comes from combining alternative data with traditional fundamentals rather than treating them as standalone signals.
Core idea: simultaneously post bids and offers, earning the spread on every round-trip. Historically the domain of HFT firms, but slower-moving variants exist for retail in less efficient markets — small-cap equities during specific hours, certain crypto pairs, options on illiquid underlyings.
The catch: adverse selection. Informed traders pick off your stale quotes. Unless you can detect toxic flow and adjust quotes in real time, market making bleeds capital. Approach with caution.
Core idea: volatility itself is a tradeable characteristic. Strategies in this family include selling rich implied volatility, dispersion trades, term-structure plays on the VIX curve, and volatility-targeted equity allocation.
For investors comfortable with options, volatility selling has produced durable returns — punctuated by occasional disasters. Sizing is everything. The relationship between volatility products and a healthy understanding of risk is something we explored in our piece on effective hedging strategies.
Artificial intelligence has moved from buzzword to production workhorse in algorithmic trading. But the way AI is actually used in modern systems is often misunderstood — most of the value is not coming from "an AI that predicts the market," but from AI that handles tasks humans cannot scale.
The practical takeaway: use AI as a force multiplier for parts of the pipeline where it shines, and keep human judgment in the loop for regime shifts, risk overrides, and strategy decommissioning. The most successful funds in 2026 are not "AI funds" — they are quantitative funds that have thoughtfully integrated AI components into a broader research and risk framework.
Theory is comfortable, practice is humbling. Here is a step-by-step process to take you from idea to validated strategy without the most common pitfalls.
Write down — in plain language — why you believe a pattern should exist. "Stocks that beat earnings on revenue and raise guidance tend to drift higher for several weeks because analysts are slow to revise estimates." That is a hypothesis. "I'll throw 200 features into XGBoost and see what sticks" is not. Without a thesis, you will overfit noise and never know it.
Which instruments? US large-cap stocks? European mid-caps? A specific ETF basket? What is your minimum liquidity threshold? Maximum position size? Holding period? Define these before you look at any data — otherwise the data will define them for you, in your favor, invisibly.
Use a data provider that supplies dividend- and split-adjusted prices, delisted tickers (no survivorship bias), and as-reported fundamentals with proper publication timestamps. Skipping this step is the single most common reason backtests deceive their authors.
Write the signal logic in a way that processes one bar at a time, using only information available at that bar. If your code looks ahead — even by one tick — your backtest is fiction. Tools like vectorbt, backtrader, zipline-reloaded, and modern proprietary frameworks make this discipline easier to enforce.
Run your strategy on the in-sample period, then on out-of-sample data it has never seen. Run a walk-forward analysis: refit parameters on a rolling window and trade on the next window. Apply realistic transaction costs (commissions, spread, market impact). If the edge survives all of this with reasonable parameter stability, you have something worth taking seriously.
How does the strategy behave during 2008, 2020, the 2022 bear market, the 2023 banking crisis? What happens with double the assumed slippage? With a 30% larger drawdown? If a 10% perturbation breaks your edge, the edge probably was not real.
Run the strategy in a simulated environment with live data feeds for at least 30–90 days. You will discover dozens of small bugs — timezone issues, missing corporate actions, broker API quirks — that no backtest could surface.
Start with a fraction of your intended capital. Monitor live P&L against expected P&L for any meaningful divergence. Scale up only when the live track record matches simulation.
Backtesting is where most strategies are born and where most are silently born dead. The problem is not the technique itself — it is human nature.
If you test enough strategy variants on the same data, by pure chance some will look brilliant. This is data dredging, and it is the original sin of quantitative research. The defenses are well known but rarely fully practiced:
A strategy with a 1.2 Sharpe that you fully understand will outperform a 2.5 Sharpe black box you cannot explain — because when the latter inevitably draws down, you will have no basis for deciding whether to cut it or trust it. For a deeper discussion of how Sharpe ratios are calculated and why they matter, see our companion piece on the Sharpe ratio.
Every experienced systematic trader will tell you the same thing: your edge is not what you think it is, and your risk is bigger than you assume. Risk management is not an add-on to a trading strategy — it is the most important strategy you have.
Volatility-targeted position sizing — sizing positions inversely to their realized volatility — is a simple, robust improvement over equal dollar weights. Half-Kelly or fractional-Kelly sizing on edge estimates works well when edges are stable. Fixed fractional risk per trade (1–2% of capital) is appropriate for trend systems.
Maximum gross exposure, maximum net exposure, sector concentration limits, correlation-adjusted exposure caps. These are not bureaucratic formalities; they are the rails that keep your account intact when a correlated cluster of positions moves against you simultaneously.
Define in advance — ideally before you deploy any capital — what drawdown level will trigger a strategy review, a position cut, or full shutdown. Decisions made in the calm of pre-deployment are vastly superior to decisions made in the panic of a 20% drawdown.
Our broader treatment of how to manage risk in financial investments applies just as much — if not more — to systematic strategies. Algorithms remove emotion from individual trades, but they do not protect you from the emotion of watching a strategy bleed in real time.
Pattern-recognize these. Almost everyone who fails at algorithmic trading fails for one of the following reasons.
The 2026 toolchain is more accessible than ever. A reasonable starting stack looks like this:
Beyond raw tools, integrated platforms can dramatically shorten the research-to-deployment loop. AssetWhisper provides real-time market data, technical and fundamental analytics, AI-generated trend signals across multiple horizons, and weekly automated market reports — exactly the inputs most retail systematic traders cobble together from five different services. If you are building your first algorithmic strategy, starting from a platform that already solves the data and analytics problem lets you focus on what actually generates edge: your research. You can read more about how AssetWhisper integrates into a serious investment workflow.
Algorithmic trading does not exempt you from securities regulations — in some ways, it adds new ones. Depending on your jurisdiction, you may need to consider:
None of this is legal or tax advice — and the rules continue to evolve. Consult a qualified professional in your jurisdiction before deploying capital, especially at scale.
Three trends are shaping the next several years of systematic trading:
Rather than hand-coding every strategy, traders increasingly work alongside AI assistants that propose hypotheses, write research code, flag suspicious backtest results, and explain model decisions. The human role shifts toward direction-setting and judgment; the AI handles execution.
Datasets that were once exclusive to multi-billion-dollar funds — satellite imagery, mobile-app telemetry, supply-chain data — are becoming retail-affordable. Whoever learns to use this data thoughtfully will have a meaningful edge for the next several years.
On-chain markets, tokenized real-world assets, and 24/7 trading venues are reshaping the boundaries of what an algorithmic trader can access. Liquidity is fragmenting; cross-venue arbitrage and latency-tolerant systematic strategies are gaining importance. We touched on adjacent themes in our overview of emerging technologies in financial trading.
Algorithmic trading in 2026 is more accessible, more capable, and more competitive than ever before. The tools that used to define institutional edge — clean data, fast compute, advanced ML, real-time execution — are now within reach of any disciplined retail trader. What remains scarce is not technology, but rigor: the willingness to falsify your own ideas, size positions conservatively, monitor relentlessly, and walk away from strategies that no longer work.
If you are starting out, do not try to build a hedge fund in your first month. Pick one strategy family from this article — momentum is a reasonable starting point, with mean-reversion pairs as a close second — and walk through every step: hypothesis, universe, data, signal, backtest, walk-forward, paper trade, small live deployment. Each iteration teaches you more than ten books.
If you are already trading systematically, use this article as a diagnostic. Are your backtests honestly out-of-sample? Is your risk layer as developed as your signal layer? Are you genuinely diversified across uncorrelated edges, or do you have five flavors of the same trend bet?
And if you want a head start on the data, analytics, and AI signals that power modern algorithmic trading, create your AssetWhisper account and explore our trend analysis, returns dashboards, and weekly automated market reports. The platform is designed to be the layer beneath your strategy — handling the infrastructure so your research time goes where it matters most.
Markets reward patience, discipline, and curiosity. Algorithms are simply how those virtues scale. Welcome to the work.
Discover how algorithmic trading can transform your investment approach with proven profitable strategies, practical implementation guides, and real-world examples designed for both beginners taking their first steps and intermediate traders ready to scale.
Algorithmic trading represents the evolution of financial markets, where computer programs execute trades based on predetermined rules and mathematical models. In 2025, this isn't just for Wall Street anymore – it's becoming the standard for serious individual traders who want to compete effectively in modern markets.
The financial markets have fundamentally changed. With over 70% of all trades now executed by algorithms, manual trading is increasingly becoming a disadvantage. But here's the good news: the tools and knowledge that were once exclusive to hedge funds are now accessible to individual traders like you.
Key Benefits of Algorithmic Trading:
Three major developments have converged to make 2025 the year algorithmic trading becomes mainstream:
According to recent QuantInsti research, retail traders using algorithmic strategies have seen average returns improve by 23% compared to discretionary trading.
The landscape of trading automation has matured significantly. What was once a fragmented ecosystem of complex tools has evolved into user-friendly platforms that don't require a PhD in computer science.
Modern algorithmic trading operates on three levels:
Level 1: Strategy Development Using platforms like Python with libraries such as pandas, NumPy, and scikit-learn, traders can develop sophisticated strategies in hours, not months.
Level 2: Execution Infrastructure Cloud-based execution ensures your strategies run 24/7 with 99.99% uptime, connecting directly to broker APIs.
Level 3: Risk Management Layer Real-time monitoring and automatic kill switches protect your capital when markets behave unexpectedly.
Let's dive into five profitable strategies that are generating consistent returns for algorithmic traders in 2025. Each strategy includes expected returns, risk levels, and implementation complexity.
Strategy Overview: This strategy capitalizes on the tendency of prices to revert to their average over time, enhanced with volatility-based entry and exit signals.
Implementation Details:
Performance Metrics:
Code Example (Python):
def mean_reversion_signal(data):
# Calculate Bollinger Bands
data['MA20'] = data['Close'].rolling(20).mean()
data['STD'] = data['Close'].rolling(20).std()
data['Upper'] = data['MA20'] + (data['STD'] * 2)
data['Lower'] = data['MA20'] - (data['STD'] * 2)
# Generate signals
data['Buy'] = (data['Close'] < data['Lower']) & (data['RSI'] < 30)
data['Sell'] = data['Close'] > data['MA20']
return data
Strategy Overview: Identifies strong trends early by detecting breakouts from consolidation patterns, confirmed by unusual volume spikes.
Implementation Details:
Performance Metrics:
Strategy Overview: Exploits temporary divergences between historically correlated assets, betting on convergence.
Implementation Details:
Performance Metrics:
Strategy Overview: Leverages natural language processing to analyze news sentiment and social media trends for predictive signals.
Implementation Details:
Performance Metrics:
Strategy Overview: Combines signals from multiple timeframes to identify and ride major trends while filtering out noise.
Implementation Details:
Performance Metrics:
Starting your algorithmic trading journey doesn't require years of programming experience. Here's a practical roadmap to implement your first profitable strategy in 30 days.
Day 1-3: Environment Setup
Day 4-7: Data Collection
Core Components Every Algorithm Needs:
def generate_signals(data): # Your logic here return buy_signals, sell_signalsdef calculate_position_size(capital, risk_per_trade): return capital * risk_per_tradedef set_stop_loss(entry_price, atr, multiplier=2): return entry_price - (atr * multiplier)Critical Backtesting Metrics to Track:
Common Backtesting Pitfalls:
Pre-Launch Checklist:
The right tools can make the difference between success and failure in algorithmic trading. Here's a comprehensive comparison of platforms for different trader profiles.
1. TradingView with Automation
2. MetaTrader 5 (MT5)
1. QuantConnect
2. Alpaca + Python
1. Interactive Brokers API
2. Custom Cloud Infrastructure
Must-Have Python Libraries:
# Data manipulation
import pandas as pd
import numpy as np
# Technical indicators
import ta
import talib
# Backtesting
import backtrader
import zipline
# Machine learning
from sklearn.ensemble import RandomForestClassifier
import tensorflow as tf
# Visualization
import matplotlib.pyplot as plt
import plotly.graph_objects as go
Without proper risk management, even the most profitable algorithmic trading strategy will eventually fail. Here's how to protect your capital while maximizing returns.
Kelly Criterion Implementation:
def kelly_position_size(win_probability, avg_win, avg_loss):
"""
Calculate optimal position size using Kelly Criterion
"""
edge = (win_probability * avg_win) - ((1 - win_probability) * avg_loss)
odds = avg_win / avg_loss
kelly_percentage = edge / odds
# Use 25% of Kelly for safety
return min(kelly_percentage * 0.25, 0.02) # Max 2% per trade
Adaptive ATR-Based Stops:
System Circuit Breakers:
Key Metrics to Track:
Risk Dashboard Example:
class RiskMonitor:
def __init__(self, portfolio):
self.portfolio = portfolio
self.max_daily_loss = 0.02
self.max_positions = 10
def check_risk_limits(self):
alerts = []
# Check daily P&L
if self.portfolio.daily_pnl < -self.max_daily_loss:
alerts.append("CRITICAL: Daily loss limit exceeded")
# Check position count
if len(self.portfolio.positions) > self.max_positions:
alerts.append("WARNING: Too many open positions")
return alerts
Learn from the mistakes of others to preserve your capital and accelerate your success in algorithmic trading.
The Problem: Creating a strategy that performs perfectly on historical data but fails miserably in live trading.
The Solution:
The Problem: A strategy showing 30% annual returns becomes unprofitable after accounting for spreads, commissions, and slippage.
The Solution:
def calculate_real_returns(gross_returns, trades_per_year):
commission_per_trade = 0.001 # 0.1%
spread_cost = 0.0005 # 0.05%
slippage = 0.0005 # 0.05%
total_cost_per_trade = commission_per_trade + spread_cost + slippage
annual_trading_cost = total_cost_per_trade * trades_per_year * 2 # Buy and sell
net_returns = gross_returns - annual_trading_cost
return net_returns
The Problem: Your signals are correct, but execution delays cause you to miss optimal entry/exit points.
The Solution:
The Problem: Running multiple strategies without proper capital allocation leads to margin calls or missed opportunities.
The Solution:
The Problem: Markets change, and strategies that worked yesterday may fail tomorrow.
The Solution:
Once you have a profitable strategy, scaling requires careful planning and infrastructure investment.
Focus Areas:
Infrastructure Needs:
Expansion Strategy:
Infrastructure Upgrade:
Institutional Features:
Team Considerations:
Monthly Tracking Sheet:
| Metric | Target | Current | Action Needed |
|---|---|---|---|
| Total Return | >2% | ___ | ___ |
| Sharpe Ratio | >1.2 | ___ | ___ |
| Max Drawdown | <10% | ___ | ___ |
| Win Rate | >50% | ___ | ___ |
| System Uptime | >99% | ___ | ___ |
The next frontier in algorithmic trading is here, and it's powered by artificial intelligence and machine learning.
The same technology behind ChatGPT is revolutionizing market prediction:
Applications:
Implementation Example:
from transformers import pipeline
# Initialize sentiment analyzer
sentiment_analyzer = pipeline("sentiment-analysis",
model="ProsusAI/finbert")
def analyze_news_sentiment(headlines):
sentiments = sentiment_analyzer(headlines)
# Convert to trading signals
bullish_score = sum(1 for s in sentiments if s['label'] == 'positive')
bearish_score = sum(1 for s in sentiments if s['label'] == 'negative')
return bullish_score / len(sentiments)
Expected Breakthroughs:
DeFi Integration:
Compliance Automation:
You now have a comprehensive understanding of profitable algorithmic trading strategies. Here's your action plan for the next 30 days:
A: You can begin paper trading with $0 and start live trading with as little as $1,000. However, we recommend $5,000-$10,000 for meaningful returns after covering costs. Our strategies are designed to scale from $5K to $5M+.
A: Not necessarily. While Python knowledge helps, many successful traders start with no-code platforms and learn programming gradually. Our course includes "Python for Non-Programmers" specifically for traders.
A: With proper strategy implementation and risk management, most students see positive results within 60-90 days. However, we recommend 6 months of consistent trading to evaluate true strategy performance.
A: Yes, but it requires adequate capital, multiple proven strategies, and strict risk management. Most successful traders start part-time and transition gradually as their systems prove profitable.
A: Algorithmic trading encompasses all automated strategies, from long-term investing to day trading. High-frequency trading (HFT) is a subset requiring specialized infrastructure and typically executing thousands of trades per second.
The shift to algorithmic trading isn't just a trend—it's the future of financial markets. With the strategies, tools, and knowledge provided in this guide, you're equipped to join the ranks of successful algorithmic traders.
Remember: Every expert was once a beginner. The difference between those who succeed and those who don't is taking action.
Start small, think big, and let algorithms work for you 24/7.
Disclaimer: Trading involves risk. Past performance does not guarantee future results. Always trade responsibly and never invest more than you can afford to lose.
Real Estate Investment Trusts (REITs) are entities that own, operate, or finance income-generating real estate properties. These financial instruments offer investors the opportunity to participate in the real estate market without the need to directly purchase, finance, or manage properties. In other words, REITs democratize access to institutional-grade real estate — the same office towers, logistics parks, data centers, and shopping hubs that were historically reserved for pension funds and ultra-high-net-worth investors.
In this comprehensive guide, we will delve deeply into the world of REITs, examining their features, benefits, types, valuation metrics, tax treatment, and practical investment strategies. You will learn how these investment vehicles can help you generate passive income through real estate, hedge against inflation, and diversify your portfolio beyond traditional stocks and bonds. Whether you are a beginner exploring how to invest in the financial market the right way or an intermediate investor looking to refine your allocation, this guide is designed to give you a complete framework for making informed REIT decisions.
REITs are entities regulated by the U.S. Securities and Exchange Commission (SEC) that must meet certain criteria to qualify as such. The REIT structure was created by the U.S. Congress in 1960 with a clear mission: to give everyday investors the same access to commercial real estate that was previously available only to wealthy individuals and large institutions. Today, REITs are a global asset class, with similar structures existing in more than 40 countries.
To qualify as a REIT under U.S. tax law, an entity must meet strict requirements, including:
Because of the 90% distribution rule, REITs essentially act as pass-through vehicles: they avoid paying corporate income tax on distributed earnings, and the tax burden shifts to shareholders. This is precisely what makes REITs such powerful income-producing assets.
At the operational level, a REIT works like a real estate business that is publicly (or privately) capitalized by shareholders. The trust uses investor capital — combined with debt — to acquire, develop, manage, or finance a portfolio of properties. Revenue flows in primarily through rent payments from tenants and, in the case of mortgage REITs, through interest payments on real estate loans.
After covering operating expenses, property maintenance, financing costs, and management fees, the remaining income is distributed to shareholders as dividends. The shareholder thus benefits from two potential sources of return: the recurring dividend yield, and capital appreciation if the underlying real estate rises in value or if rents grow over time.
Investing in REITs offers several compelling benefits that explain why they have become a staple in both conservative and aggressive portfolios.
REITs allow investors to participate in diverse properties — shopping malls, office towers, hotels, apartment complexes, warehouses, hospitals, and data centers — without the headaches of managing tenants, repairs, or financing. With a single share, you can effectively own a fractional interest in dozens or even hundreds of high-value commercial properties.
REITs are required to distribute most of their income, which typically results in dividend yields significantly higher than those of the broader stock market. For income-focused investors, this makes REITs a natural companion to other dividend strategies — a topic we explore in depth in our guide to the advantages of dividend investing.
REITs offer a powerful diversification tool because their performance is not perfectly correlated with the general stock market. Real estate cycles move on their own rhythm, driven by supply-and-demand dynamics, local economic conditions, and interest-rate cycles. Adding REITs to a stock-and-bond portfolio historically improves its risk-adjusted return — a concept you can measure objectively using the Sharpe Ratio.
In addition to dividend income, REITs can benefit from increases in the value of the properties they own. Over long horizons, quality real estate has historically appreciated above the rate of inflation, giving REITs a dual-return profile: income plus growth.
Rents and property values tend to rise with inflation, which means REITs can act as a partial inflation hedge. Many commercial leases include explicit inflation-linked escalators, allowing rental income to grow as the cost of living rises.
Unlike direct real estate, which can take months or years to sell, publicly-traded REITs can be bought and sold instantly on major exchanges. This liquidity is one of the most underappreciated advantages of the REIT structure.
REITs enjoy significant tax benefits at the corporate level, including exemption from corporate income tax on distributed earnings. This structural efficiency is the primary reason REITs can offer such attractive dividend yields.
REITs can be categorized in several ways. The two most important classifications are by business model (equity vs. mortgage vs. hybrid) and by sector focus (residential, retail, industrial, etc.).
There are several ways to gain exposure to REITs, each with different trade-offs in terms of cost, diversification, and selection risk.
Investors often wonder whether it makes more sense to buy a rental property directly or invest through REITs. The answer depends on your goals, capital, and how involved you want to be.
For most investors, especially those building their first portfolio, REITs provide the cleanest and most diversified exposure to real estate without the operational burden.
Traditional stock metrics such as earnings per share (EPS) and price-to-earnings (P/E) are misleading when applied to REITs because they include large non-cash depreciation charges. Instead, REIT analysts rely on a specialized set of metrics:
Using these specialized metrics is essential if you want to identify undervalued assets and maximize your gains in the REIT universe.
When investing in REITs, a structured strategy dramatically improves your odds of success. Below are the approaches most commonly used by experienced investors.
No investment is risk-free, and REITs come with their own particular set of vulnerabilities. A well-prepared investor understands them before committing capital — a discipline we cover in depth in our article on how to manage risk in your financial investments.
REIT taxation is one of the most misunderstood aspects of this asset class. At the investor level, REIT dividends are generally taxed as ordinary income rather than at the lower qualified-dividend rate. That's because most REIT income comes from rents and interest, not from corporate profits already taxed at the entity level.
However, there are several important nuances:
Tax rules vary significantly by country, so always consult a qualified tax advisor for personalized guidance.
The REIT landscape is being reshaped by powerful structural forces that every investor should factor into their allocation decisions.
Even experienced investors make avoidable errors in the REIT space. Recognizing them is half the battle — and many of them stem from the same psychological pitfalls we cover in our deep-dive on how emotions affect investment decisions.
Cultivating the right psychological framework is just as important as the analytical one. Our guide to developing a successful investor mindset complements this checklist perfectly.
If you're ready to start investing, here's a simple framework to structure your REIT allocation:
REITs are one of the most elegant solutions ever designed for investors who want real estate exposure without the operational complexity of direct ownership. They combine the income characteristics of bonds with the growth potential of equities, and they offer access to categories — data centers, cell towers, healthcare facilities, industrial logistics — that are almost impossible to replicate through private real estate.
That said, they are not a shortcut. REIT success still requires diversification, valuation discipline, awareness of the interest-rate environment, and the patience to let compounding work over years, not quarters. Used well, REITs can become the backbone of a reliable income stream and a powerful diversifier in any modern portfolio.
If you want to see how REITs can fit into a broader, data-driven investment strategy — combined with AI-powered analysis and algorithmic signals — explore how AssetWhisper can transform your investment portfolio and take your decision-making to the next level.
Dividend investing, a well-established strategy in the financial world, involves acquiring shares of companies that regularly distribute a portion of their profits to shareholders. These distributions, known as dividends, can be a significant source of passive income and contribute to the stability and growth of an investment portfolio over time.
Dividends are payments, typically in cash or additional shares, that a company makes to its shareholders. These payments are usually distributed quarterly or annually and represent a share of the company's profits. Companies that consistently pay dividends tend to be established entities with a history of profitability and robust cash flow.
Dividends provide a consistent flow of income that can supplement other income sources or be reinvested to acquire additional shares, accelerating wealth accumulation. This passive income can be particularly appealing to retirees or those seeking financial independence. For strategies on maximizing income, consider exploring our guide on how to identify undervalued assets and maximize your gains.
Companies that pay dividends tend to exhibit greater stability and lower volatility compared to companies that do not. This is often attributed to their established business models, prudent financial management, and commitment to returning value to shareholders. Including dividend-paying stocks in a portfolio can act as a buffer during market downturns. This aligns with crisis-proof investments that help maintain portfolio resilience.
While dividends offer a steady income stream, the underlying stocks themselves can also appreciate in value over time. This potential for capital gains can significantly enhance overall investment returns. Investors can benefit from both the regular income generated by dividends and the growth of the stock's market price. To understand the balance between income and growth, refer to the Sharpe ratio: its history, applications, and calculations in financial markets.
Dividends can help protect against the erosive effects of inflation. As the cost of living rises, many companies increase their dividend payouts over time to keep pace with inflation. This can help maintain the purchasing power of the investment and ensure that the income generated from dividends remains relevant. For more on protecting your investments, see how to manage risk in your financial investments.
Thorough research is essential to identify companies with a solid track record of dividend payments and a promising outlook for future growth. Factors such as the company's financial health, competitive position, and dividend payout ratio should be carefully evaluated. Utilizing fundamental analysis can aid in making informed decisions.
Diversifying your portfolio by investing in dividend-paying stocks across different sectors and company sizes can help mitigate risk. This approach ensures that a downturn in one sector or company does not disproportionately impact your overall investment. For strategies on building a diversified portfolio, explore how Asset Whisper can transform your investment portfolio.
Dividends may be subject to taxes, depending on your jurisdiction and the specific tax laws. It's crucial to understand the tax implications of dividend investing in your country to optimize your after-tax returns. Consulting resources on tax optimization strategies can be beneficial.
This fund targets companies with a track record of increasing dividends year after year. Its emphasis on dividend growth, rather than solely on yield, can lead to a portfolio balanced between growth and income potential, potentially offering resilience during market downturns. VIG boasts a notably low expense ratio, making it attractive to cost-conscious investors.
SCHD provides exposure to high-dividend-yielding U.S. companies with a history of consistent dividend payments. This fund combines a low expense ratio with a well-diversified portfolio across sectors. It's a suitable choice for income-focused investors who also seek some potential for capital appreciation.
DIV offers exposure to the 50 highest-yielding dividend stocks in the U.S. and makes monthly dividend distributions, appealing to investors needing regular income. However, its focus on ultra-high yielders may entail additional risk, as these companies might be in financially riskier positions.
DGRO aims to track an index of U.S. companies with a history of sustained dividend growth. It provides broad sector diversification and a relatively low expense ratio. This ETF is a good option for those seeking a blend of income and potential capital appreciation, with a focus on companies demonstrating dividend sustainability.
SDIV invests in 100 of the highest-yielding dividend stocks globally. While it offers high income potential and global diversification, the focus on ultra-high yielders can expose investors to potential risks and volatility. It's crucial to consider the underlying financial health of the companies in this ETF.
SPYD focuses on the 80 highest-yielding companies within the S&P 500. It offers a combination of income and potential capital appreciation, with the added stability of investing in large-cap companies. However, like all sector-focused funds, it may carry sector-specific risks.
SPHD tracks the S&P 500 Low Volatility High Dividend Index, targeting companies with high dividend yields and low volatility. This makes it a good choice for income-focused investors concerned about market volatility, seeking a more conservative approach to dividend investing.
NOBL focuses on S&P 500 companies that have increased their dividends for at least 25 consecutive years. It's a solid option for investors seeking stable income and long-term growth potential. However, its focus on dividend aristocrats may result in sector concentration, primarily in consumer staples and industrials.
For a deeper understanding of how dividend investing fits into broader investment strategies, explore our articles on effective strategies for investment hedging and behavioral finance: how emotions affect investment decisions.
Dividend investing can be effectively combined with various investment strategies to enhance portfolio performance. For example, integrating dividend stocks with artificial intelligence ETFs can provide exposure to cutting-edge technologies while maintaining a steady income stream. Additionally, incorporating real estate investment trusts (REITs) can further diversify your income sources and capital appreciation potential.
Investors should be aware of common mistakes in dividend investing, such as overconcentration in a single sector or relying solely on high-yield stocks without considering the underlying company's financial health. Our guide on common mistakes in stock market investing provides valuable insights into avoiding these errors and building a robust investment portfolio.
Dividend investing represents a powerful strategy for generating passive income, achieving long-term stability, and enhancing overall investment returns. By selecting companies with a strong history of dividend payments, diversifying across various sectors, and integrating dividend strategies with other investment approaches, investors can build resilient and growth-oriented portfolios.
Choosing the right dividend stocks or ETFs involves careful analysis of company fundamentals, understanding your financial goals, and staying informed about market conditions. For comprehensive guidance on optimizing your investment strategies, visit our resource on how to develop a successful investor mindset.
Whether you are a novice investor or a seasoned pro, dividend investing can be a valuable component of your financial strategy, providing both income and growth opportunities. Explore our extensive range of articles, such as how to invest in the financial market the right way, to further enhance your investment knowledge and achieve your financial goals.
The sustainable investment landscape has experienced significant evolution in 2025. Despite recording record outflows of $8.6 billion in the first quarter of 2025, total global sustainable fund assets remained relatively stable at $3.16 trillion at the end of Q1 2025, compared to $3.18 trillion in Q4 2024.
This apparent paradox reflects the sector's maturation. By the end of 2024, global sustainable fund assets reached an all-time high of USD 3.2 trillion, an 8% increase from the previous year and more than quadruple the size in 2018. Europe remains the leading market, housing 84% of assets.
"Doing good can also be a wise long-term investment strategy. Sustainable mutual funds and ESG ETFs continue to grow, with institutional investors projected to reach $33.9 trillion by 2026, representing 21.5% of assets under management." - PWC Projection
Exchange-Traded Funds (ETFs) are collections of stocks and bonds that investors can buy and sell throughout the trading day, similar to stocks on major exchanges. Unlike mutual funds, ETFs offer greater flexibility for trading, which can be especially attractive for active investors.
According to June 2025 data, these are some of the ESG ETFs with best annual returns:
Invesco Solar ETF (TAN)
Bloomberg Intelligence projects that global ESG assets will reach over $40 trillion by 2030, despite the current challenging environment. The compound annual growth rate (CAGR) of ESG ETFs from 2020 to 2025 is projected to reach 20%.
Asset managers are dealing with new regulations, including sustainable fund labeling rules such as the FCA's SDR in the UK, and ESMA's ESG fund naming guidelines in Europe. This increased regulation aims to protect investors against greenwashing risk.
Investing in sustainable and green ETFs offers a unique opportunity to align your investments with your ethical and sustainability values while potentially reaping substantial financial benefits. Although 2025 has presented challenges with record outflows in some markets, the long-term trend toward sustainability in financial markets suggests a promising future for this type of investment.
With global sustainable assets maintaining above $3 trillion and projections indicating continued growth toward $40 trillion by 2030, ESG ETFs represent not only an investment in the planet's future but also a potentially profitable and resilient investment strategy.
Note: The opinions expressed should not be construed as recommendations to buy or sell any financial instrument. Conduct your own research and consult with a financial advisor before making investment decisions. Past performance does not guarantee future results.
Last updated: September 2025
The Sharpe Ratio is a fundamental metric in finance, offering a critical lens through which investors can assess the risk-adjusted performance of their portfolios. This article delves into its origins, practical applications, and the methodology for its calculation.
Understanding the Sharpe Ratio
Developed by Nobel Laureate William F. Sharpe, the Sharpe Ratio quantifies the relationship between the return on an investment and the risk involved. Specifically, it measures how much excess return you receive for the extra volatility endured by holding a riskier asset. A higher Sharpe Ratio indicates a more favorable risk-return balance.
Introduced in 1966 by economist William F. Sharpe, the Sharpe Ratio emerged from the need to incorporate risk into the assessment of investment performance. Sharpe recognized that evaluating investment returns without considering risk presented an incomplete picture. His pioneering work provided investors with a robust framework for making more informed decisions by integrating risk into performance metrics.
The Sharpe Ratio is widely utilized across various segments of the financial industry:
The calculation of the Sharpe Ratio involves three primary components: the expected return of the investment, the return of a risk-free asset, and the standard deviation of the investment’s returns. The formula is:
[ \text{Sharpe Ratio} = \frac{(\text{Return of the investment} - \text{Return of a risk-free asset})}{\text{Standard deviation of the investment's returns}} ]
This formula measures the additional return per unit of risk, highlighting how much more return an investor can expect from a riskier asset compared to a risk-free asset.
The Sharpe Ratio is a cornerstone of financial education, providing critical insights into the risk-return profile of investments. While it should not be the sole criterion for investment decisions, it serves as an essential tool for evaluating investment performance. Mastering the Sharpe Ratio enables investors to navigate the complexities of financial markets with greater precision and confidence.
At Asset Whisper, we believe in empowering our readers with the knowledge to make informed investment choices. Understanding and utilizing the Sharpe Ratio is a vital step in that journey. By integrating this metric into your investment analysis, you can better gauge the efficacy of your investment strategies and achieve a more balanced and optimized portfolio.
The artificial intelligence revolution isn't coming—it's here, reshaping industries, transforming economies, and creating unprecedented investment opportunities. As AI transitions from experimental technology to essential infrastructure, savvy investors are seeking efficient ways to capture this transformative growth. Exchange-Traded Funds (ETFs) focused on artificial intelligence offer the perfect vehicle: diversified exposure to the AI ecosystem without the concentration risk of individual stock picking.
In 2025, AI ETFs have evolved far beyond simple tech funds. They now represent sophisticated investment instruments targeting specific AI segments—from semiconductor manufacturers powering neural networks to software companies deploying machine learning at scale. With the global AI market projected to exceed $1.8 trillion by 2030, these ETFs provide crucial access to what may be the most significant technological shift of our lifetime.
This comprehensive guide explores the AI ETF landscape in 2025, analyzing top funds, dissecting investment strategies, and revealing how to position your portfolio for the AI-driven future. Whether you're seeking pure-play AI exposure or balanced technology allocation, understanding these instruments is essential for modern portfolio construction.
Multiple forces converge in 2025 to create an unprecedented AI investment opportunity:
Technological Maturity: After years of development, AI technologies have reached commercial viability. Large Language Models (LLMs) like GPT-5 and Claude 4 demonstrate capabilities approaching human-level reasoning in specific domains. Computer vision systems achieve superhuman accuracy in medical diagnosis, quality control, and autonomous navigation. These aren't research projects—they're production-ready systems generating real revenue.
Economic Necessity: Labor shortages, inflation pressures, and global competition drive AI adoption across industries. Companies no longer view AI as optional innovation but as essential for survival. McKinsey estimates that 70% of companies will adopt at least one AI technology by 2026, up from 50% in 2024. This widespread adoption creates a massive addressable market for AI solution providers.
Infrastructure Readiness: The computing infrastructure required for AI—from advanced semiconductors to cloud platforms—has scaled dramatically. NVIDIA's latest H200 GPUs deliver 10x the performance of previous generations, while cloud providers offer AI-as-a-Service platforms accessible to any organization. This infrastructure maturity removes adoption barriers, accelerating deployment.
Regulatory Clarity: After years of uncertainty, major economies have established AI regulatory frameworks. The EU's AI Act, US federal guidelines, and China's AI regulations provide clear rules for development and deployment. This regulatory clarity reduces investment risk and encourages institutional capital allocation.
AI's economic impact rivals that of the internet revolution:
For investors, this represents a generational wealth-creation opportunity. Unlike previous tech bubbles built on speculation, AI companies generate substantial revenue and demonstrate clear paths to profitability. The question isn't whether to invest in AI, but how to best capture this growth.
These funds focus exclusively on companies deriving significant revenue from AI technologies:
Characteristics:
Investment Focus:
Traditional tech funds increasingly dominated by AI leaders:
Advantages:
Key Holdings:
The "picks and shovels" approach to AI investing:
Investment Thesis:
Core Components:
Physical manifestation of AI in the real world:
Growth Drivers:
Sector Exposure:
Overview: One of the largest and most established AI ETFs, BOTZ provides comprehensive exposure to companies developing or utilizing AI and robotics technologies.
Key Metrics (2025):
Top Holdings:
Investment Case: BOTZ offers balanced exposure across AI software, hardware, and robotics applications. Its global focus captures opportunities beyond US markets, particularly in Japanese and European automation leaders. The fund's track record since 2016 demonstrates consistent outperformance during AI adoption cycles.
Overview: Broader thematic ETF capturing companies at the forefront of exponential technological development, with significant AI allocation.
Key Characteristics:
AI Exposure (approximately 45% of portfolio):
Why Consider: XT provides AI exposure within a broader innovation framework, reducing concentration risk while maintaining growth potential. Ideal for investors seeking technology transformation beyond pure AI.
Overview: Tracks the Nasdaq CTA Artificial Intelligence and Robotics Index, focusing on companies engaged in AI and robotics development within these categories: enablers, engagers, and enhancers.
Unique Features:
Performance Drivers:
Overview: Actively managed by ARK Invest, focusing on companies expected to benefit from autonomous technology and robotics development.
Cathie Wood's AI Vision:
Key Themes:
Risk Considerations: Higher volatility due to concentration and growth focus. Active management creates style risk. Suitable for aggressive investors with long-term horizons.
Overview: Combines AI pure-plays with companies implementing AI for competitive advantage.
Investment Philosophy:
Differentiation: WTAI emphasizes companies generating actual AI revenue rather than conceptual exposure, providing more fundamental support during market corrections.
The explosion of generative AI creates specific investment opportunities:
Direct Beneficiaries:
Investment approach: Look for ETFs with high weighting in software companies rapidly integrating generative AI capabilities.
AI processing moving from cloud to edge devices:
Growth Catalysts:
Key Players:
The backbone enabling AI deployment:
Cloud Platforms:
Data Management:
Next-generation computing for AI:
Investment Timeline: 3-7 years for commercial viability Key Players: IBM, Google, Microsoft, Rigetti, IonQ ETF Exposure: Limited but growing through tech funds
Understanding emerging technologies in financial trading helps contextualize AI's broader impact on markets.
Core Holdings (60-70%):
Satellite Positions (30-40%):
Conservative (20% AI Allocation):
Moderate (40% AI Allocation):
Aggressive (60%+ AI Allocation):
Don't overlook international AI opportunities:
United States (50-60%): Innovation leaders, established ecosystems China (15-20%): Scale advantages, government support Europe (10-15%): Industrial AI, robotics expertise Japan/South Korea (10-15%): Semiconductor, automation leadership
Concentration Risk: Many AI ETFs heavily weighted toward few mega-cap stocks
Valuation Risk: AI stocks trading at premium multiples
Technology Risk: Rapid obsolescence, winner-take-all dynamics
Regulatory Risk: Potential AI restrictions, antitrust actions
Implementing effective strategies for investment hedging becomes crucial with volatile AI investments:
Options Strategies:
Correlation Management:
Quantitative Metrics:
Qualitative Factors:
Beyond simple returns, consider:
Risk-Adjusted Returns: Use the Sharpe Ratio to evaluate risk-adjusted performance
Factor Exposure:
Scenario Analysis:
AI ETFs offer tax advantages over mutual funds:
In-Kind Redemption: Minimizes capital gains distributions Tax Loss Harvesting: Easier with liquid ETFs Qualified Dividends: Most distributions qualify for favorable rates International Exposure: Foreign tax credits available
Asset Location:
Timing Considerations:
Next-Generation Funds:
Structural Innovations:
The AI investment landscape will evolve dramatically:
2025-2027: Consolidation phase as winners emerge
2027-2030: Maturation and specialization
Beyond 2030: Transformation complete
Modern investment platforms enhance AI ETF investing:
How Asset Whisper can transform your investment portfolio by providing:
The rise of robo-advisors makes AI ETF investing accessible:
Understanding common mistakes in stock market investing helps navigate AI ETF pitfalls:
Evaluate your investment mindset and readiness:
Based on your assessment:
Starter Portfolio Example:
Month 1-3: Establish core positions
Month 4-6: Build to target
Month 7-12: Optimize and monitor
How to manage risk in your financial investments with AI ETFs:
Consider these complementary approaches:
Individual AI Stocks: For concentrated bets on winners Private Equity: Access to pre-IPO AI companies Venture Capital: Early-stage AI investments Real Estate: Data center REITs supporting AI infrastructure
Explore related investment opportunities:
Artificial Intelligence ETFs represent more than just another technology investment—they offer participation in humanity's next evolutionary leap. As AI transforms every industry from healthcare to transportation, from finance to entertainment, these funds provide diversified exposure to this revolutionary change.
The year 2025 marks an inflection point where AI transitions from promising technology to economic necessity. Companies not adopting AI risk obsolescence, while AI leaders capture disproportionate value. For investors, AI ETFs offer the optimal vehicle to capture this transformation: professional management, instant diversification, liquidity, and cost efficiency.
Success in AI investing requires more than just buying the right ETFs. It demands understanding the technology, monitoring developments, managing risk appropriately, and maintaining discipline through volatility. The investors who prosper will be those who view AI not as a speculative bet but as a fundamental shift requiring thoughtful, strategic allocation.
As you embark on your AI investment journey, remember that we're still in the early stages of this revolution. The AI companies dominating markets in 2035 may not even exist today. By investing through ETFs, you position yourself to capture wherever value emerges, without needing to predict specific winners.
The question isn't whether AI will transform our world—it's how quickly and profoundly. For prepared investors, AI ETFs provide the gateway to participate in this transformation. The revolution is here, the tools are available, and the opportunity is unprecedented.
Welcome to the AI investment revolution. Your portfolio's future depends on the decisions you make today.
Ready to start your AI investment journey? Explore how modern platforms combine AI analysis with comprehensive market tools to optimize your ETF selection and portfolio management. The future of investing is intelligent—make sure your approach is too.