Yield Curve Inversions and Recessions: What Nine Signals Since 1953 Actually Show
Key takeaway
Since 1953 the 10-year minus 3-month Treasury spread has inverted nine times. Seven inversions were followed by a recession 5 to 16 months later. Two were not: 1966, and the record 2022–2024 inversion, which has not been followed by a recession the NBER has dated. The signal says little about timing, and less about stocks.
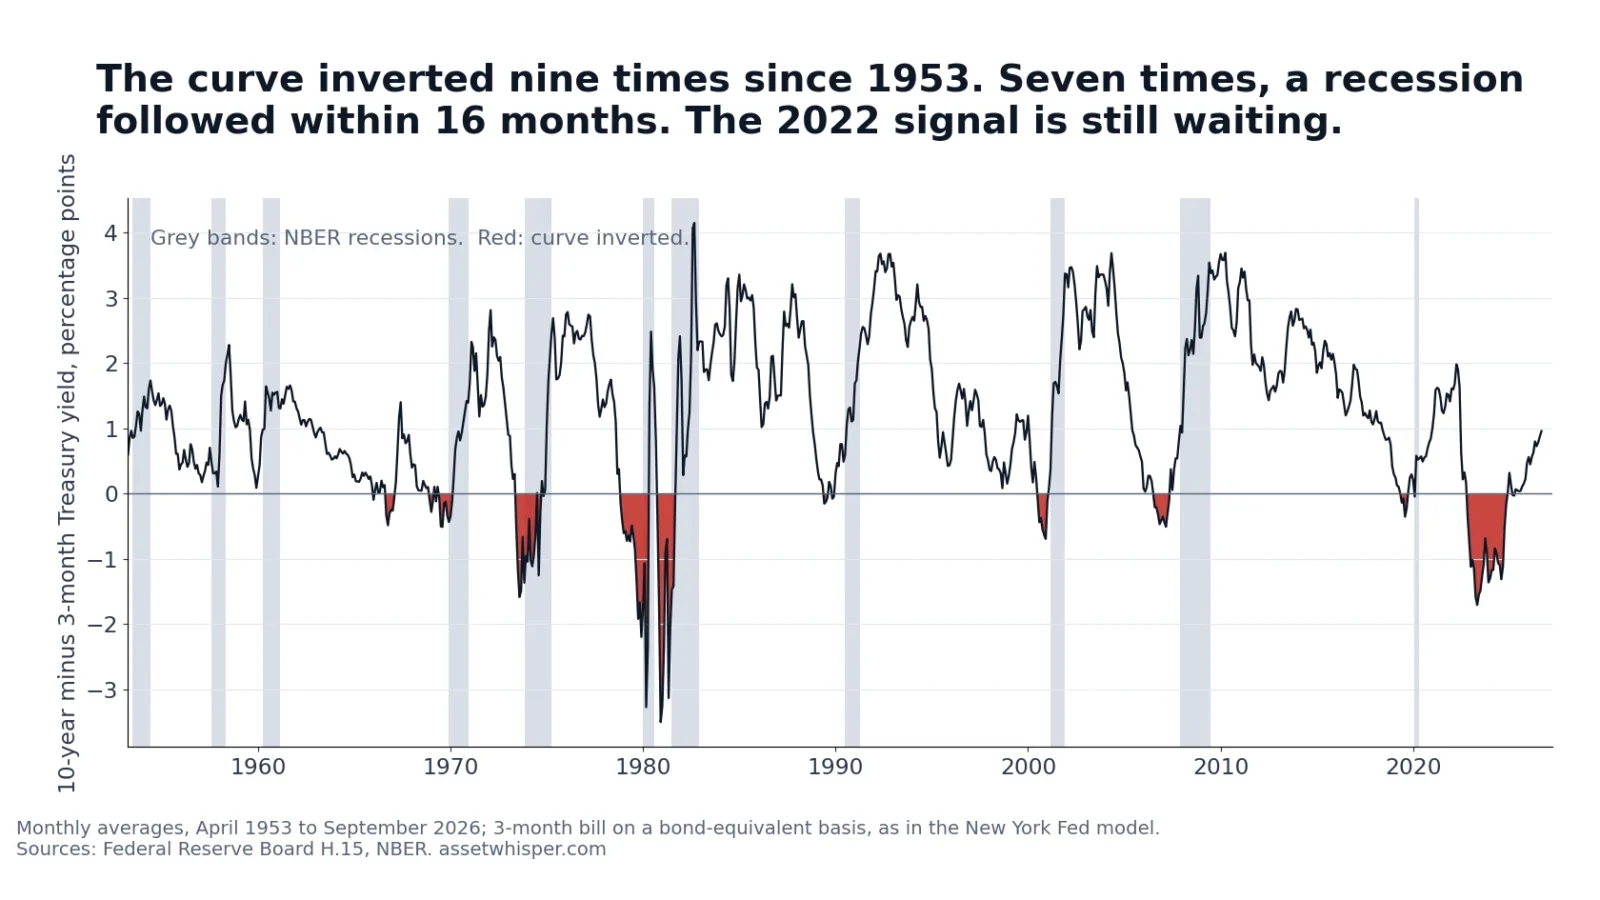
An inverted yield curve has come before every US recession since 1969. That sentence is true, and it is why the curve makes headlines every time a Treasury spread crosses zero. It is also built on a handful of events, and it leaves out the two that do not fit: the 1966 inversion, followed by a recession almost four years later, and the 2022 inversion, the longest on record, which as of October 2026 has not been followed by a recession the NBER has dated.
We rebuilt the indicator the Federal Reserve Bank of New York uses in its recession model, the 10-year Treasury yield minus the 3-month Treasury bill, in monthly averages from April 1953 to September 2026, and set it against the NBER’s recession dates. The curve inverted nine times. Seven times a recession began 5 to 16 months later; twice it did not. Eight of the ten recessions since 1955 had an inversion in the two years before them; the 1957 and 1960 recessions did not. And in the year after the curve inverted, the S&P 500 rose more often than it fell.
The short answer, in one table
A signal here is the first month in which the monthly average spread turned negative after at least twelve months without an inversion. “Inverted” counts the months below zero in that episode; “lead” is the number of months from the signal to the NBER’s recession start (the business-cycle peak).
| Signal | Inverted | Deepest | Recession began | Lead |
|---|---|---|---|---|
| Jan 1966 | 7 months | −0.49 | Dec 1969 | 47 months (false alarm) |
| Dec 1968 | 13 months | −0.51 | Dec 1969 | 12 months |
| Jun 1973 | 16 months | −1.59 | Nov 1973 | 5 months |
| Nov 1978 | 30 months | −3.51 | Jan 1980 | 14 months |
| Jun 1989 | 5 months | −0.16 | Jul 1990 | 13 months |
| Jul 2000 | 7 months | −0.70 | Mar 2001 | 8 months |
| Aug 2006 | 10 months | −0.51 | Dec 2007 | 16 months |
| Jun 2019 | 5 months | −0.36 | Feb 2020 | 8 months |
| Nov 2022 | 27 months | −1.71 | none dated | 46+ months (to Sep 2026) |
“Deepest” is the lowest monthly spread in the episode, in percentage points. The 1978 episode ran, with interruptions, until September 1981 and spans two recessions, 1980 and 1981. Our monthly spread matches the series the New York Fed publishes for its model to the second decimal in every month since 1959.
Seven hits: what “predicted” actually meant
Seven of nine is a good record for a single number, and the original research on it is careful about what it claims. Arturo Estrella and Frederic Mishkin, in the 1996 New York Fed paper that made this spread the standard, found that it predicted recessions “two to six quarters ahead” better than stock prices or the index of leading indicators. Three details are easy to lose on the way to a headline.
- The lead time is wide. Among the seven hits, the recession began between 5 and 16 months after the signal, with a median of 12. A signal that may come a few months or well over a year early says little about when.
- The recession usually came after the curve turned positive again. In 1969, 1973 and 1980 the recession began while the curve was still inverted. In the four most recent hits it began as the inversion ended or later: 7 months after the last inverted month in 1990, 2 in 2001, 7 in 2007, and in the same month in 2020. Waiting for the curve to “un-invert” as an all-clear has been the wrong reading.
- The base rate matters. In 27.6% of all months from 1953 to 2024, a recession began within the following 24 months. After a signal it happened 7 times in 9. The signal clearly carries information, but the sample is nine events, one of which (2020) was a recession caused by a pandemic that no bond market forecast. Leave it out and the record is 6 of 8.
The New York Fed’s own model expresses the signal as a probability rather than a verdict. Twelve months before the December 2007 recession began, it put the odds at 39.4%; twelve months before February 2020, at 24.6%. It has never been designed to give a yes or no.
The misses: two false alarms, two silent recessions
The 1966 signal is the first false alarm. The curve inverted from January 1966 to February 1967, and the next recession did not start until December 1969, 47 months later, after the curve had inverted again in December 1968. Counting 1966 as a hit stretches the definition of a forecast until it can no longer fail.
The misses run the other way too. The recessions that began in August 1957 and April 1960 had no inversion in the 24 months before them. The spread came close in December 1959, at 0.09 points, but flat is not inverted.
The more popular 10-year minus 2-year spread, available from 1976, has a slightly weaker record. In daily data it inverted in six episodes; four were followed by a recession within 24 months (after 13 to 23 months), one in 1998 lasted six weeks and was followed by a recession 33 months later, and the sixth is the 2022 episode. The 10-year minus 3-month spread is the one the research and the New York Fed’s model use, which is why it is the one in our table.
2022–2024: the longest inversion on record, and no recession dated
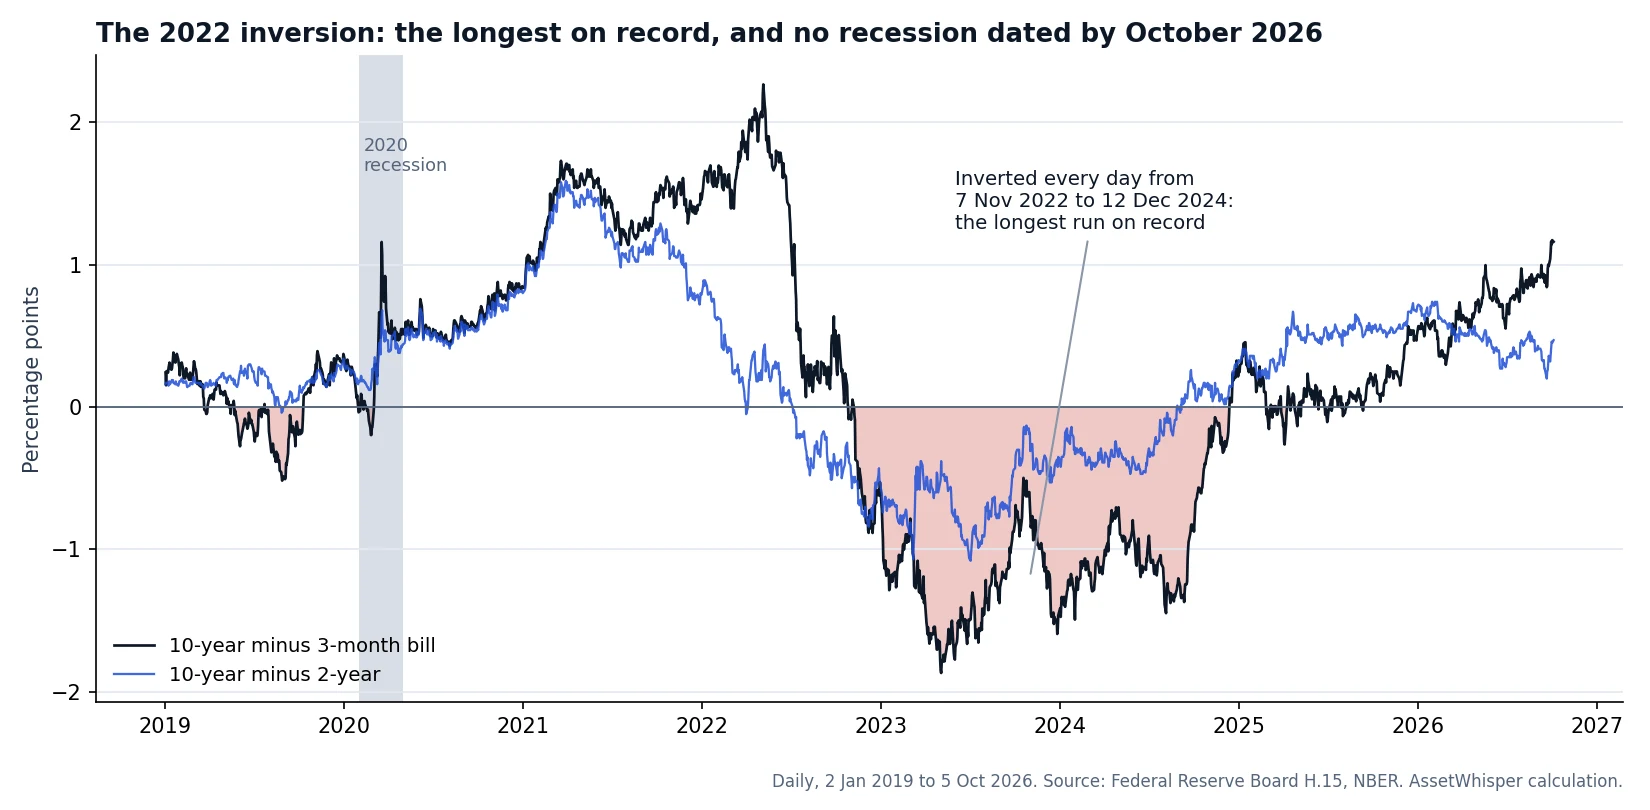
By every measure, the inversion that began in 2022 was the strongest signal in decades.
- Length: in daily data, the 10-year minus 3-month spread was negative in every session from 7 November 2022 to 12 December 2024, 766 days. The previous record was 528 days, from November 1978 to May 1980. The 10-year minus 2-year spread was negative from 6 July 2022 to 26 August 2024, 782 days, against a previous record of 622.
- Depth: the monthly spread reached −1.71 points in May 2023 (−1.87 on 4 May in daily data), the deepest inversion since 1981.
- The model’s reading: from the May 2023 spread, the New York Fed’s model put the probability of a recession by May 2024 at 70.9%, its highest reading since 1982, and above 50% for 20 of the 21 months from January 2024 to September 2025.
As of 7 October 2026, the NBER has not dated a recession after the one that began in February 2020. Counting to September 2026, the signal is 46 months old; the longest lead among the seven hits was 16 months. The curve last spent a month inverted in April 2025, after a brief relapse that spring; the longest gap between the end of an inversion and a recession among the hits was 7 months, and 17 have passed.
One caveat is fair. The NBER dates recessions after the fact: it announced the December 2007 peak on 1 December 2008 and the February 2020 peak on 8 June 2020. A recession that began in recent months might not be dated yet. But one that began by March 2024, within the longest lead in the record, would on every past precedent have been announced by now.
Why this inversion failed is a question one episode cannot settle. One candidate is the term premium, the extra yield investors demand for holding long bonds, which we explain in why bond yields rise when central banks cut rates: when it is unusually low, the 10-year can fall below bill rates without the market expecting the deep rate cuts that a recession normally brings. That is a hypothesis, not a finding.
Where the curve stands now: on 5 October 2026 the 10-year yield was 5.31% and the 3-month bill 4.15% on a bond-equivalent basis, a spread of +1.16 points; the 10-year minus 2-year spread was +0.47. The September average was +0.96. From the August spread, the New York Fed’s model puts the probability of a recession by August 2027 at 13.9%.
What stocks did after the curve inverted
A recession signal is not a stock market signal, and the record shows why. We measured the S&P 500’s total return, monthly averages with dividends, from each signal month.
| Signal | Next 12 months | To recession start | Market high |
|---|---|---|---|
| Jan 1966 | −6.4% | +10.6% | Dec 1968 |
| Dec 1968 | −11.7% | −11.7% | Dec 1968 |
| Jun 1973 | −11.3% | −1.4% | Oct 1973 |
| Nov 1978 | +15.3% | +24.4% | Nov 1980 |
| Jun 1989 | +15.0% | +15.2% | Jul 1991 |
| Jul 2000 | −17.2% | −18.8% | Aug 2000 |
| Aug 2006 | +15.0% | +17.7% | Oct 2007 |
| Jun 2019 | +9.5% | +14.8% | Feb 2021 |
| Nov 2022 | +15.7% | n/a | Nov 2024 |
“Market high” is the month the index peaked between the signal and twelve months after the recession began (two years after the signal for 2022). In the twelve months after a signal the index rose five times and fell four, with a median of +9.5%. The high came a median of 20 months after the signal. Over the following year, selling on the signal would have avoided losses after 1966, 1968, 1973 and 2000; after 1978, 1989, 2006, 2019 and 2022 it meant giving up 9.5% to 15.7%. The curve has been a better guide to the economy than to the stock market. How deep and how long the declines around recessions were is in bear markets since 1950.
What the record supports, and what it does not
- Supported: since 1953, seven of nine inversions of the 10-year minus 3-month spread were followed by a recession within 16 months, against a base rate of about one month in four.
- Supported: every recession since 1969 had an inversion in the two years before it.
- Supported: the 2022–2024 inversion was the longest on record and, as of October 2026, has not been followed by a dated recession, the first false alarm since 1966.
- Not supported: that an inversion “always” leads to a recession, or that it says when. Leads ran from 5 to 16 months, and two signals were not followed by a recession within two years.
- Not supported: that an inversion is a reason to sell stocks. The market rose in the following year after five of nine signals.
- Not tested: other countries, other spreads such as near-term forward rates, and anything before 1953. Nine signals is a small sample, and any rule tuned to fit them would fit the past better than the future.
Frequently asked questions
Does an inverted yield curve always mean a recession is coming?
No. Since 1953 the 10-year minus 3-month Treasury spread inverted nine times, and a recession began within 16 months in seven of them. In 1966 the recession came almost four years later, and the 2022 inversion has not been followed by a recession dated by the NBER as of October 2026.
How long after the yield curve inverts does a recession start?
Among the seven inversions followed by a recession, the gap was 5 to 16 months, with a median of 12. In the four most recent cases the recession began after the curve had already turned positive again, between 0 and 7 months later.
Which spread matters more, 10-year minus 2-year or 10-year minus 3-month?
The research and the New York Fed’s recession model use the 10-year minus 3-month spread. On the same test the 10-year minus 2-year spread did slightly worse since 1976: four of six inversions were followed by a recession within 24 months, against seven of nine for the 3-month version since 1953.
Is the yield curve inverted now?
No. On 5 October 2026 the 10-year yield was 5.31% and the 3-month bill 4.15% on a bond-equivalent basis, a spread of +1.16 points, and the 10-year minus 2-year spread was +0.47. The monthly average has been positive in every month since April 2025.
Why did the 2022 inversion not lead to a recession?
One episode cannot answer that. A low term premium, the extra yield investors demand for holding long bonds, is one proposed explanation, because it can push long yields below short ones without the market expecting the rate cuts a recession brings. The NBER also dates recessions with a lag of up to a year, but a recession within the historical lead time would by now have been dated.
Should I sell stocks when the yield curve inverts?
The record does not support it as a rule: in the year after the nine signals since 1966, the S&P 500 rose five times and fell four, with a median return of +9.5%. This article describes history and does not make recommendations; AssetWhisper does not publish trade signals.
How we calculated this
- Spread: the monthly average 10-year Treasury constant-maturity yield minus the monthly average 3-month Treasury bill rate (secondary market), converted from a discount yield to a bond-equivalent yield, as in the New York Fed’s model. Data from the Federal Reserve Board’s H.15 release, April 1953 to September 2026. Our series matches the New York Fed’s published spread in every month from January 1959 to August 2026.
- Signals: the first month with a negative spread after at least 12 consecutive months without one. A signal counts as followed by a recession if an NBER business-cycle peak falls within the next 24 months.
- Recessions: NBER business-cycle peaks and troughs, monthly. Base rate: the share of months from April 1953 to September 2024 in which a peak followed within 24 months.
- Daily runs: H.15 daily yields from January 1962 (2-year from June 1976), excluding days with no data. Run lengths are in calendar days from the first to the last negative session. For the 10-year minus 2-year record, an episode is a run of at least five negative sessions, merged with any other run less than a year away.
- Stocks: S&P Composite total return from Robert Shiller’s monthly data (monthly average prices with dividends reinvested), from the signal month.
- Limits: nine signals and ten recessions in one country; NBER dates are revised and announced with a lag. The script that prints every figure in this article is kept with its working files.
Sources
- Board of Governors of the Federal Reserve System, H.15 Selected Interest Rates, full data package, data to 5 October 2026.
- Federal Reserve Bank of New York, The Yield Curve as a Leading Indicator, monthly spread and recession probabilities, data to August 2026.
- National Bureau of Economic Research, US Business Cycle Expansions and Contractions and Business Cycle Dating Committee announcements, accessed 7 October 2026.
- Arturo Estrella and Frederic S. Mishkin, “The Yield Curve as a Predictor of U.S. Recessions”, Current Issues in Economics and Finance, 2(7), Federal Reserve Bank of New York, June 1996.
- Robert J. Shiller, U.S. Stock Markets 1871–Present and CAPE Ratio (S&P Composite total return).
Related reading
- Why bond yields rise when central banks cut rates — what the yield curve’s shape says, and the term premium.
- The 10-year Treasury at 5% — why long yields rose in 2026, split into real yield and inflation.
- Bear markets since 1950 — how deep and how long the falls that recessions bring have been.
- The impact of interest rates on investment choices — how rate changes reach each asset class.
This article is general information, not personalised investment advice. It does not take into account the financial situation, objectives, tax position or risk tolerance of any individual reader, and the same text is distributed to all readers. Historical statistical relationships describe the past under stated assumptions and are not forecasts; yields quoted describe the dates stated. Capital is at risk.