Index Funds vs Active Management: What 25 Years of Scorecards Actually Show
Key takeaway
Over the 20 years to June 2026, 92.6% of US large-cap active funds trailed the S&P 500 after fees, and only about 51 of 690 both survived and beat it. The harder problem is picking them in advance: five-year persistence among winners was no better than chance.
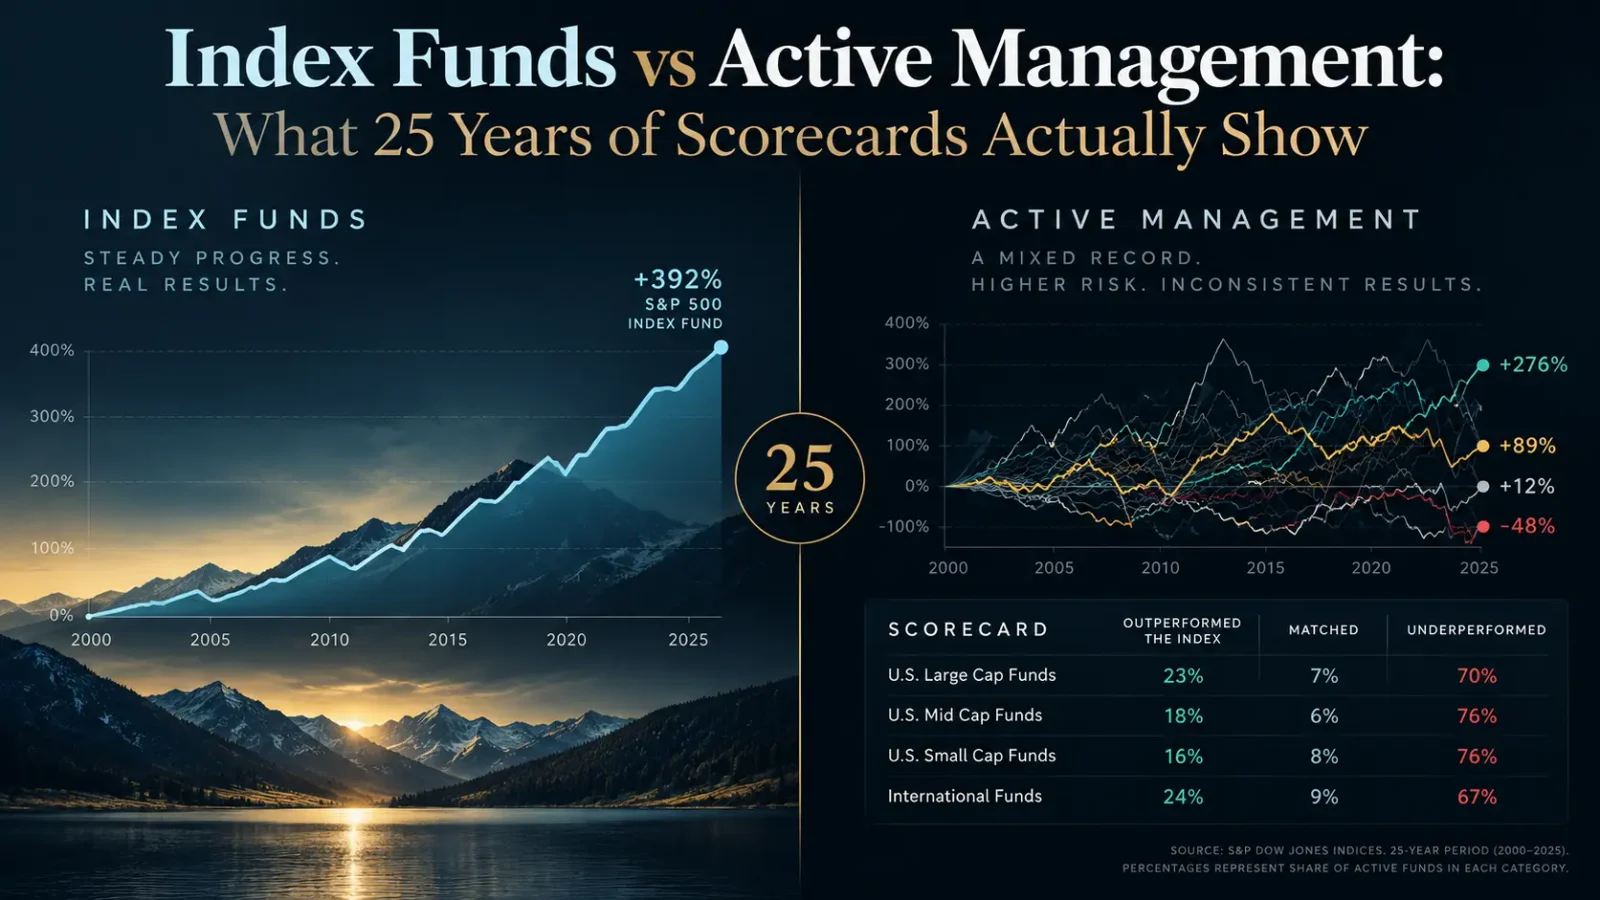
The case for index funds is usually made with one number: roughly nine in ten active funds trail their benchmark over the long run. That number is accurate, and it is not the argument. A scorecard that counts funds tells you the odds of a manager chosen at random. Nobody picks at random. The real question is whether the minority that does win can be identified before the fact — and the same scorecards that produce the famous headline also answer that one, in a section almost nobody quotes.
This article reads the latest editions of both: S&P Dow Jones Indices’ SPIVA U.S. Scorecard for mid-year 2026, published on 17 September 2026 with data to 30 June, and its Persistence Scorecard with data to the end of 2025. It adds the fee data from the Investment Company Institute, the independent check Morningstar runs against real index funds, and the most serious academic criticism of the SPIVA method — because a scorecard is only as useful as its rules.
What the scorecard measures, and why its denominator matters
SPIVA compares every actively managed US mutual fund and ETF in a category with the index for that category: large-cap funds against the S&P 500, small-cap value funds against the S&P SmallCap 600 Value, and so on. Fund returns are net of fees, excluding sales loads. Index funds, leveraged and inverse products are excluded.
The rule that does most of the work is the denominator. A fund counts as a winner only if it survived the whole period and beat the index; the percentage is taken over every fund that existed at the start. A fund that was closed or merged along the way counts as not having beaten the index. That is the correct question for an investor standing at the start of the period — the closed funds were part of what you could have bought — but it is also the rule critics object to most, and we return to it below.
The record, by horizon
The table shows the share of funds that trailed their benchmark over each period ending 30 June 2026. The last column counts how many of the 13 individual style categories (large-cap growth, small-cap value, real estate and so on) had a majority of funds beating their index.
| Period to 30 Jun 2026 | All US equity funds | Large-cap | Mid-cap | Small-cap | Categories where most funds won (of 13) |
|---|---|---|---|---|---|
| First half of 2026 | 48.3% | 67.2% | 74.4% | 68.5% | 3 |
| 1 year | 60.8% | 78.7% | 76.2% | 68.5% | 2 |
| 3 years | 79.3% | 76.6% | 72.3% | 54.8% | 3 |
| 5 years | 91.4% | 89.3% | 77.0% | 55.6% | 2 |
| 10 years | 88.2% | 83.3% | 78.4% | 71.1% | 0 |
| 15 years | 93.3% | 90.5% | 87.7% | 91.1% | 0 |
| 20 years | 94.9% | 92.6% | 90.5% | 91.2% | 0 |
Three things stand out. First, the short-horizon numbers are genuinely mixed: over five years, 70% of small-cap value funds beat their index, and in the first half of 2026 most large-, mid- and multi-cap value funds did too. Second, those pockets close with time. Past ten years there is no category in which most funds won; over 15 years the best category still had 84.0% of funds trailing (mid-cap growth), and over 20 years 86.1% (large-cap value). Third, the pattern holds year by year: in 22 of the 25 calendar years from 2001 to 2025, most large-cap funds trailed the S&P 500. The exceptions were 2005, 2007 and 2009.
The first half of 2026 is a useful test because it was, on paper, a good environment for stock pickers. S&P reports that the average dispersion between S&P 500 stocks was the highest since 2008, mid- and small-caps beat large-caps by 7 and 14 points, and leadership rotated away from the largest names. Two-thirds of large-cap funds still trailed. In 2025, the figure was 79% — the fourth-worst year in the scorecard’s 25-year history.
Three filters: survive, beat the index, and be findable
The headline percentage compresses three separate hurdles into one. Pulling them apart for US large-cap funds over the 20 years to June 2026:
| Filter | Large-cap funds | Share of starting funds |
|---|---|---|
| Existed in mid-2006 | 690 | 100% |
| Still existed in mid-2026 | 252 | 36.5% |
| Survived and beat the S&P 500 over the 20 years | ≈51 | 7.4% |
| Identifiable in advance from past performance | See the persistence tests below: not reliably | |
The middle rows explain why survivorship matters so much. If you look only at funds that still exist — which is what a fund screener shows you today — about one in five beat the index over 20 years. Counting the 438 funds that were closed or merged along the way, it is roughly one in fourteen. The graveyard is not a rounding error; it is most of the starting field. Across all US equity funds the same arithmetic gives about 112 winners from 2,190 starters.
Closures are not random, either. In the Persistence Scorecard’s five-year transition data, 23.1% of the worst-quartile US equity funds from 2015–2020 were merged or liquidated over the following five years, against 9.8% of the best quartile. Poor performers are removed, and the survivors look better for it.
What the gap costs in money
Percentages of funds say nothing about how far behind the laggards were. SPIVA also publishes average returns, both with every fund weighted equally and weighted by assets, which is closer to what the average invested dollar earned. Over the 20 years to June 2026, annualised and net of fees:
| Over 20 years to 30 Jun 2026 | Annual return | $10,000 became | Share of the index outcome |
|---|---|---|---|
| S&P 500 | 11.39% | $86,482 | 100% |
| Average dollar in large-cap active funds (asset-weighted) | 10.33% | $71,429 | 82.6% |
| Average large-cap active fund (equal-weighted) | 9.47% | $61,080 | 70.6% |
The asset-weighted line is better than the equal-weighted one, which is worth noticing: the larger funds, where most of the money sits, did better than the typical fund. The average dollar still gave up about 1.06 percentage points a year, and compounding turned that into roughly $15,000 on a $10,000 stake — the same mechanism described in how much of a compounded sum was ever yours, running in reverse.
Why it happens: arithmetic first, then fees
The underlying reason was set out by William Sharpe in 1991, in a three-page paper titled “The Arithmetic of Active Management”. The market return is the average return of everyone who holds the market. Index investors earn it, less a very small cost. So the other group, active investors taken together, must also earn the market return before costs — and less than it after them. Under Sharpe’s definitions this is arithmetic, not an empirical finding that could turn out differently next year. Active management as a whole is a zero-sum game before fees and a negative-sum game after them. Individual managers can win, but only at the expense of other active managers.
The costs are measurable. According to the Investment Company Institute’s 2026 Fact Book, the asset-weighted expense ratio of actively managed equity mutual funds was 0.64% in 2025, against 0.05% for index equity mutual funds. It was higher earlier in the SPIVA window: 0.96% in 2010 and 0.71% in 2020. Expense ratios also exclude trading costs inside the fund. Put that beside the 1.06-point shortfall of the average active dollar and most of the gap is accounted for by what active funds charge — which is exactly what Sharpe’s arithmetic predicts. The cost side of this is laid out in more detail in stock market mistakes, ranked by what they cost, where fees sit near the top of the list.
Can the winners be picked in advance?
This is where the argument is decided, because an investor who could reliably find the minority of winning funds would not care how many losers there were. The Persistence Scorecard tests it directly: take the best-performing funds in one period and see whether they stay near the top. The useful comparison is against pure chance — what would happen if every year’s ranking were a coin toss.
| Test (US large-cap funds unless stated) | Observed | Pure chance | Reading |
|---|---|---|---|
| Top half in 2021, still top half in each of the next four years (334 funds) | 4.49% (≈15 funds) | 6.25% (≈21 funds) | Slightly below chance; a shortfall this size happens by luck about 11% of the time |
| Top quartile in 2021, still top quartile in each of the next four years (164 funds) | 0 funds | 0.39% (0.64 funds) | Consistent with luck: under pure chance, zero is the likeliest outcome (53%) |
| Top half in 2023, still top half in 2024 and 2025 (338 funds) | 49.4% (≈167 funds) | 25% (≈85 funds) | Far above chance: real short-term persistence |
| Mid-cap top half 2015–20 → top half 2020–25* | 11.3% | 83.3% of the bottom half moved up | Strong reversal |
| Small-cap top half 2015–20 → top half 2020–25* | 20.2% | 82.1% of the bottom half moved up | Strong reversal |
Two readings of this table are common and both are wrong. The first is that “zero top-quartile funds stayed on top” proves there is no skill at all. With 164 funds and a one-in-256 chance of four more top-quartile years by luck, you would expect 0.64 funds; getting zero is what luck usually produces. The statistic cannot tell skill from luck at that sample size. The second is that past performance means nothing. Over three years it plainly meant something: nearly half of the 2023 leaders stayed in the top half, twice the chance rate.
The accurate reading is narrower and more useful. Rankings persist over short windows and then fade or reverse, and in mid- and small-caps the reversal is dramatic — the previous period’s laggards were several times more likely to lead the next. That is what you would expect if much of a fund’s relative performance comes from its style riding a cycle (growth versus value, smaller versus larger companies) rather than from repeatable stock selection. Buying last period’s leaders means buying the style at the top of its run. The same instinct — extrapolating a recent streak — is one of the biases with a measured cost.
Where active management has a better record
An honest reading of the data has to include the places where active funds did well, because they exist.
- Small-cap and value categories over short-to-medium horizons. Over five years to June 2026, 70% of small-cap value funds and 53% of small-cap core funds beat their benchmarks. These categories also show the strongest reversals, so the edge has not been stable.
- International and emerging markets in some periods. In the first half of 2026 only 49% of international funds and 38% of emerging market funds trailed, helped by large gaps between countries such as South Korea and India. In 2025 the same categories were at 63% and 53%.
- Bonds, unevenly. Across fixed income categories the average underperformance rate was 38% in the first half of 2026 — and 70% in calendar 2025. Morningstar’s barometer finds fixed income and real estate among the categories with the strongest ten-year success rates.
- Cheap active funds. Morningstar reports that choosing from the lowest-cost fifth of active funds improved the odds of success in 16 of the 20 categories it tracks. At the other extreme, only 5% of active US large-growth funds survived and beat their passive peers over the ten years to June 2026.
The common thread is that active management’s better results appear where benchmarks are less efficient, where the index itself is a poor portfolio, or where costs are low — and rarely in US large-cap stocks, which is where most people’s money is.
The strongest criticism of SPIVA, and what survives it
Three finance academics — Martijn Cremers (Notre Dame), Jon Fulkerson (Dayton) and Timothy Riley (Arkansas) — argue in a 2026 paper that SPIVA understates active performance. The paper was summarised in May 2026 by the Investment Adviser Association, the advisers’ trade body, and is promoted through its Active Managers Council. They make three objections: funds that leave the sample are counted as losers regardless of how they had performed; funds are counted equally rather than by assets; and the comparison is with a theoretical index rather than with an index fund you can actually buy. With all three changed, they find that 43% of domestic equity fund assets outperformed over the five years to 2024, against SPIVA’s 15% of funds.
Each objection has some force, and each has a limit. Counting every exit as a loss is harsh on a fund merged while ahead — but exits are 2.35 times as common in the worst quartile as in the best, so most exits really are losers. Asset weighting is a fair demand, and SPIVA already publishes it: the asset-weighted large-cap shortfall over 20 years is the 1.06 points in the table above. Comparing with a real index fund is also fair, but at an asset-weighted 0.05% a year it moves the comparison very little, and Morningstar’s barometer, which does compare with real passive funds, reaches the same broad conclusion. Even on the critics’ own method, most domestic equity fund assets underperformed — although in high yield bonds they found the opposite, with 86% of assets ahead. The paper changes how large the gap looks; it does not reverse it.
The practical consequence
For most investors in most asset classes, the evidence points to a simple default: hold the core of the portfolio in low-cost index funds, and treat any active fund as a deliberate exception that has to justify itself. That default is a large part of why broad index funds sit at the centre of the 60/40 portfolio and of most robo-advisor allocations.
If you do use active funds, the data suggests a few rules:
- Choose on cost before anything else. It is the one predictor of success that holds up across Morningstar’s categories.
- Prefer categories where the record is better — some bond, small-cap and international mandates — over US large-cap, where the index is hardest to beat.
- Do not buy last period’s leaders. Three-year winners tend to fade, and in mid- and small-caps they tend to reverse.
- Judge the fund over ten years or more, against the right index, and include what it charges. A good year proves little; the scorecards show plenty of good years in careers that ended below the benchmark.
- Remember that you can be different without being active. Many “active” results come from tilts — towards value, small companies or particular regions — that are now available as low-cost index funds. The same point runs through our look at ESG funds, where the broad funds are index funds with exclusions, and at AI ETFs, where the label matters less than the fee and the holdings.
What this does not say
These scorecards cover US-domiciled funds, and most of the long-horizon evidence is from US equities, one of the most heavily analysed markets in the world. The 20-year window starts in mid-2006 and ends in a market unusually concentrated in a few giants — by December 2025 the seven largest technology-linked companies made up 34.9% of the S&P 500, according to S&P — which makes the index harder to beat for any fund that holds less of them. Nothing here says that no manager has skill, or that an index is the best possible portfolio; it says that skill, where it exists, is hard to distinguish from luck in advance and is usually consumed by costs. Future results may differ from these historical figures.
Frequently asked questions
What percentage of active funds beat the S&P 500?
Over the 20 years to 30 June 2026, 92.6% of US large-cap active funds underperformed the S&P 500 after fees, according to the SPIVA U.S. Mid-Year 2026 scorecard — so about 7.4% survived and beat it. Over one year the figure varies widely; in 2025, 79% underperformed, and in the first half of 2026, 67%.
What is the SPIVA scorecard?
SPIVA (S&P Indices Versus Active) is a twice-yearly report from S&P Dow Jones Indices, published since 2002, that compares actively managed funds with the index for their category. It counts closed and merged funds, uses returns net of fees, and publishes both equal-weighted and asset-weighted average returns.
Why do most active funds underperform index funds?
Mainly costs. Before costs, active investors as a group must earn the market return, because together they and index investors hold the market. After costs, active investors as a group must earn less. In 2025 the average active equity mutual fund dollar paid a 0.64% expense ratio, against 0.05% for index equity mutual funds, before trading costs.
Do funds that outperformed in the past keep outperforming?
Over short periods, somewhat: 49.4% of top-half large-cap funds in 2023 stayed in the top half through 2025, twice the chance rate. Over five years, persistence largely disappears — only 4.49% of the 2021 top-half large-cap funds stayed there for four more years, slightly below the 6.25% expected by chance — and in mid- and small-caps the rankings tended to reverse.
Is active management better for bonds or small caps?
The record is better there, but it is not consistently good. Over five years to June 2026, 70% of small-cap value funds beat their index. In bonds, the average SPIVA category underperformance rate was 38% in the first half of 2026 but 70% in 2025. Morningstar finds that low-cost active funds give the best odds in almost every category.
Is the SPIVA methodology biased against active funds?
Critics argue it is, because it treats every closed fund as a loser, counts funds rather than assets, and compares with an index that has no costs. Adjusting for all three, one 2026 study found 43% of domestic equity fund assets beat their benchmarks over five years to 2024, versus 15% of funds in SPIVA. That narrows the gap considerably but still leaves most domestic equity assets behind.
Sources
- Ganti, A., Flaherty, L. and Didio, N., SPIVA U.S. Scorecard Mid-Year 2026, S&P Dow Jones Indices, 17 September 2026, data as of 30 June 2026. Reports 1a (underperformance by horizon), 2 (survivorship), 3 and 4 (equal- and asset-weighted returns), Exhibit 1 (calendar-year large-cap results) and Appendix B (methodology: denominator, net-of-fee returns). Source data: CRSP Survivor-Bias-Free US Mutual Fund Database.
- Ganti, A., Di Gioia, D., Didio, N. and Flaherty, L., SPIVA U.S. Scorecard Year-End 2025, S&P Dow Jones Indices, data as of 31 December 2025. Calendar-2025 category results and the “fourth-worst year” comparison.
- Ganti, A., Di Gioia, D., Didio, N. and Flaherty, L., U.S. Persistence Scorecard Year-End 2025, S&P Dow Jones Indices, data as of 31 December 2025. Reports 1, 2, 5 and 6 (persistence tracking and transition matrices).
- Investment Company Institute, 2026 Investment Company Fact Book, Figure 6.4, asset-weighted average expense ratios of actively managed and index mutual funds, 2000–2025.
- Morningstar, “Active Fund Manager Success Rates Ticked Up in 2026, but Passive Funds Still Hold the Advantage”, summary of the US Active/Passive Barometer, data as of 30 June 2026.
- Sharpe, W. F., “The Arithmetic of Active Management”, Financial Analysts Journal, vol. 47, no. 1, January/February 1991, pp. 7–9.
- Cremers, K. J. M., Fulkerson, J. and Riley, T. B., “How the SPIVA U.S. Scorecard Understates the Performance of Actively Managed Mutual Funds”, 2026, as summarised by the Investment Adviser Association, 5 May 2026.
- Fund counts, dollar outcomes, chance benchmarks and binomial probabilities are our own calculations from the published figures above. A pure-chance benchmark assumes each fund has a 50% chance of a top-half year (25% for top-quartile) independently each year.
Related reading
- Stock market mistakes, ranked by what they cost — fees and overtrading, measured in points a year.
- Behavioral finance: six biases with a measured cost — why last year’s winner feels like the safe choice.
- Compound interest: how much of the final sum was ever yours — the arithmetic that turns one point a year into a sixth of the final sum over 20 years.
- Is 60/40 still alive? — building the core the index funds sit in.
- How often should you rebalance — the maintenance an index portfolio still needs.
- The Sharpe ratio — the standard way to compare returns after adjusting for risk.
- Bear markets since 1950 — what holding the index through the bad years has actually involved.
- What type of investor are you? — deciding the mix before choosing the funds.
This article is general information, not personalised investment advice. It does not take into account the financial situation, objectives or risk tolerance of any individual reader, and the same text is distributed to all readers. It does not recommend any specific fund. All figures describe specific historical periods and fund universes and do not predict future outcomes. Capital is at risk and past performance does not indicate future results.