Why Bond Yields Rise When Central Banks Cut Rates
Key takeaway
The Federal Reserve is holding at 3.50%-3.75% while the US 10-year Treasury sits near 4.8% and the 30-year is at levels last seen in 2007. The policy rate and the bond market are two different prices set by two different mechanisms, and in 2026 they are moving apart. What duration and the term premium actually mean for a portfolio.
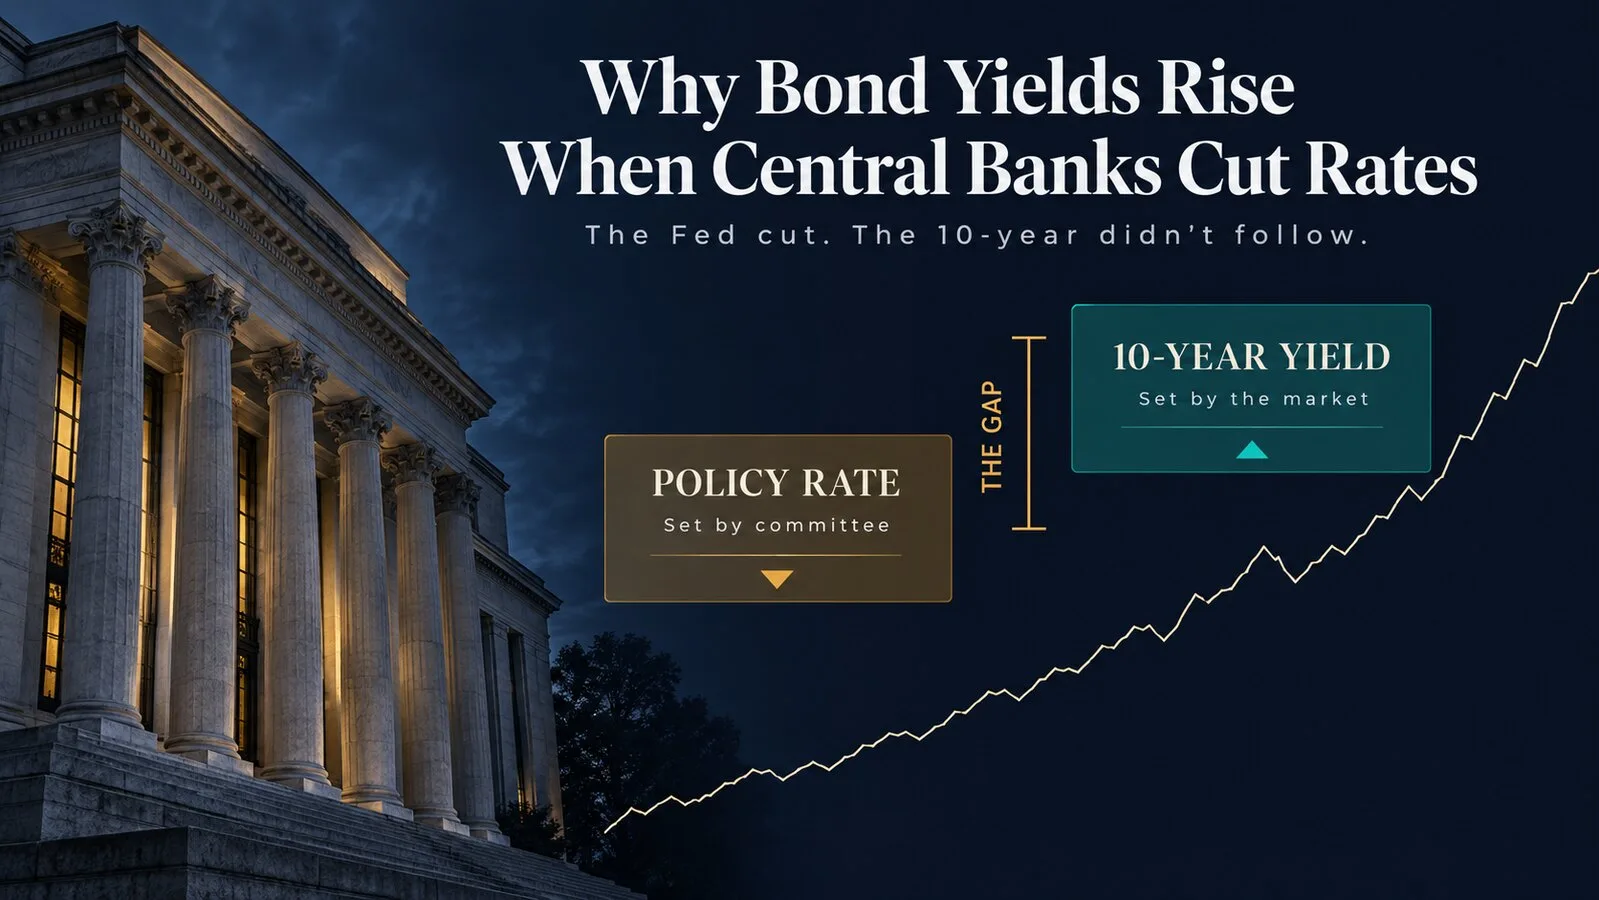
There is a sentence that gets repeated every time a central bank meets: rates are coming down, so borrowing gets cheaper and bonds go up. In September 2026 you can hold that sentence next to the actual numbers and watch it fall apart. The Federal Reserve’s target range sat at 3.50%–3.75% from the end of the 2024–25 cutting cycle until 16 September, when it was raised a quarter point to 3.75%–4.00%. The US 10-year Treasury yield was already around 4.8% before that move and closed at 5.01% on 16 and 18 September and at 5.18% on 24 September, its highest close since July 2007. The 30-year is at levels last seen in 2007.
The policy rate went one way and the bond market went the other. That is not a malfunction, and it is not new — it is what happens when you confuse two prices that are set by two different mechanisms. One is administered by a committee. The other is auctioned every day by everyone who owns or wants to own government debt. This article explains how the second one works, why it stopped following the first, and what the distinction actually changes for a portfolio.
Two prices, two mechanisms
| The policy rate | The bond yield | |
|---|---|---|
| Who sets it | A central bank committee, by vote | Every buyer and seller in the market, continuously |
| What it applies to | Overnight lending between banks | Borrowing for 2, 10 or 30 years |
| What it prices | Today’s stance on inflation and employment | Expected future policy, expected inflation, and the compensation demanded for uncertainty |
| How often it moves | Eight scheduled meetings a year | Every second the market is open |
| What it drives | Savings rates, floating-rate debt, short-term financing | Mortgages, corporate borrowing costs, discount rates for equities |
The row that explains most of the confusion is the last one. The rate you hear announced on the news is not the rate that sets a 30-year mortgage or a company’s ten-year financing cost. Those follow the long end of the government curve, and a central bank influences the long end only indirectly — through what the market believes it will do over the next decade, not through what it did this month.
What a bond actually is, and why price moves against yield
A bond is a loan with a fixed schedule. You hand over the principal, you receive a stated coupon for a stated number of years, and you get the principal back at the end. The coupon is fixed at issue and never changes.
That last fact is the whole mechanism. Suppose you own a bond paying €40 a year on €1,000 — a 4% coupon. New bonds are then issued paying 5%. Nobody will buy your 4% bond for €1,000 when €1,000 buys a 5% stream instead. The only way your bond sells is at a discount deep enough that €40 a year on the reduced price works out to roughly 5%. Around €800, it does.
Nothing happened to the issuer. Nothing happened to your coupon. The bond simply repriced so that its fixed payments deliver the return the market now demands.
The practical consequence: “bond prices fall when yields rise” is not a market opinion or a behavioural pattern. It is arithmetic on a fixed cash flow. The two statements are the same statement.
Duration: the number that tells you how much you can lose
If price and yield move against each other, the obvious question is by how much. That number is duration, and it is the single most useful thing a private investor can learn about fixed income.
Duration is expressed in years, but treat it as a sensitivity multiplier: for each percentage point that yields rise, the price falls by roughly the duration, in percent.
| Instrument | Approx. duration | Price change if yields rise 1pp | Price change if yields fall 1pp |
|---|---|---|---|
| 3-month bill | ~0.25 | −0.25% | +0.25% |
| 2-year note | ~1.9 | −1.9% | +1.9% |
| 10-year note | ~8 | −8% | +8% |
| 30-year bond | ~17 | −17% | +17% |
Figures are illustrative approximations for government bonds trading near par; actual duration depends on coupon and price.
Two things follow from that table, and both are commonly missed.
First, “bonds” is not one asset class with one risk level. A three-month bill and a thirty-year bond are issued by the same government with the same credit quality, and one of them can lose seventeen percent in a year while the other cannot lose one. Anyone who says they hold bonds has said almost nothing until they say how long.
Second, duration cuts both ways, and it is why the long end is where the money is made and lost. The same 17 that hurts in a selloff is the 17 that pays in a rally.
The practical consequence: before buying any bond fund, find its average duration in the factsheet. That one number tells you more about what you are exposed to than the fund’s name, its yield, or its star rating.
What the yield curve is actually saying
Plot the yield of government bonds against how long they run and you get the yield curve. Its shape is a statement about the future, and reading it is simpler than it is usually made to sound.
A ten-year yield is, in principle, the average short-term rate the market expects over the next ten years, plus an extra amount for the risk of being wrong. So when the ten-year sits well above the overnight rate — as it did in September 2026, roughly 4.8% against a 3.50%–3.75% policy range before the 16 September hike — the market is saying one of two things: it expects short rates to be higher on average over the coming decade than they are today, or it wants to be paid more to commit money for ten years, or both.
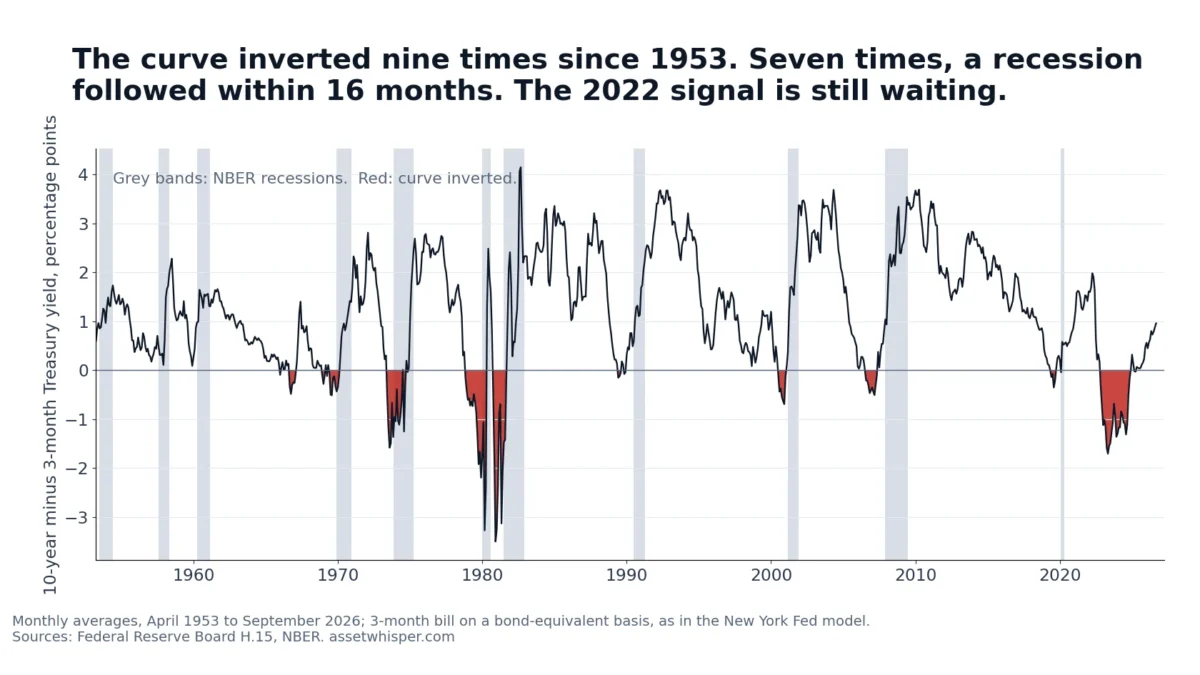
That second component has a name, and in 2026 it is the part that matters. Whether an inverted curve predicts recessions is a separate question; we checked all nine inversions since 1953 in yield curve inversions and recessions.
The term premium came back
The term premium is the extra compensation an investor demands for holding a long bond instead of rolling short ones. Think of it as an uncertainty charge: for the whole decade, you cannot know what inflation will do, what fiscal policy will do, or what the central bank will do.
For most of the 2010s that charge was close to zero, and at times negative. Inflation was low and predictable, central banks were buying long bonds in size, and the uncertainty being priced was small. A generation of investors learned fixed income in that environment and absorbed a rule — long bonds rally when the central bank eases — that was true under those specific conditions.
Those conditions ended. In 2026 the drivers pushing the term premium back up are consistent across the analysis:
- Deficits and issuance. Governments are borrowing heavily, which means a large and growing supply of long-dated paper that someone has to absorb. More supply at the same demand means a lower price, which is to say a higher yield. The same arithmetic runs in reverse for a country that stops borrowing: Argentina’s spread over Treasuries fell by roughly 1,500 basis points after its budget moved into surplus.
- Inflation that is no longer assumed away. The risk that inflation runs hotter than expected over ten years is being priced rather than dismissed, and that risk falls entirely on the holder of a fixed coupon.
- Policy uncertainty in both directions. A wider range of plausible outcomes for rates over a decade is itself a reason to demand more compensation, regardless of which outcome you consider most likely. In the United States the midterm elections on 3 November widen that range on the fiscal side, because control of Congress shapes the path of spending and issuance.
- Central banks stepping back as buyers. Japan is the clearest case. The Bank of Japan still holds almost half of all Japanese government bonds and is cutting its purchases to about a third of the old pace; in September 2026 the 10-year JGB closed above 3% for the first time since 1996. We look at who buys Japan’s debt now and what it means for Treasuries.
This produces the result that looks paradoxical from the outside: after a dovish central bank communication, long yields can rise. If the market reads easier policy as a signal of either economic weakness or a higher tolerance for inflation, the compensation it demands for a ten-year commitment goes up, not down. The policy rate fell and the price of long-term money rose.
Where rates actually stand
Levels as of early September 2026. Treat them as a snapshot, not a forecast — the point of the table is the relationship between the rows, which outlasts the numbers.
| Rate | Level | Context |
|---|---|---|
| US federal funds target | 3.50% – 3.75% | Held at the most recent meeting |
| US 10-year Treasury | ~4.8% | Near a three-year high |
| US 30-year Treasury | Highest since 2007 | Where the term premium shows up most |
| ECB deposit facility | Markets pricing a rise toward 2.5% | Tightening, not easing |
| German 10-year Bund | ~3.35% – 3.40% | Highest since April 2011 |
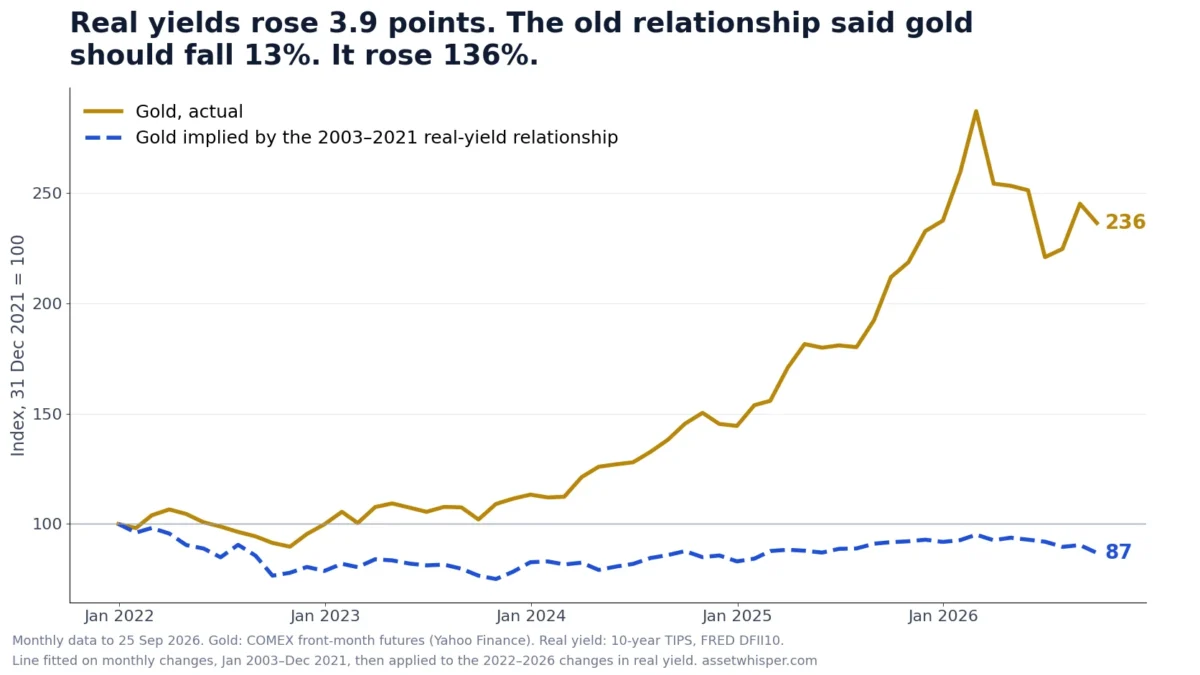
Update, 25 September 2026: on 16 September the Fed raised its target range to 3.75%–4.00%, its first increase since July 2023, and the 10-year closed at 5.01% on 16 and 18 September and at 5.18% on 24 September. What drove the climb to 5% is in the 10-year Treasury at 5%: it was real yields, not inflation expectations.
Two observations are worth more than the individual figures.
The US long end is roughly a full percentage point above the policy rate. The old shorthand — that the central bank sets the cost of borrowing — describes the top row and not the two below it.
And both blocs have turned toward tightening. The Fed held through early September after a period of easing, then raised rates on 16 September, while markets price a euro-area deposit rate near 3% by mid-2027. For anyone holding assets in both currencies, the relative pace shows up in exchange rates and in the relative appeal of the two bond markets, which is a second-order effect of the same mechanism.
As for where the US 10-year ends the year, published forecasts run from roughly 3.75% to 4.65%, with several houses clustered in a 4%–4.5% band. That spread — nearly a full percentage point between professionals with the same data — is itself the most honest available statement about how predictable this is.
What this changes for a portfolio
Four consequences follow, and none of them is a trade.
A bond allocation needs a duration decision, not just a percentage. Deciding to hold 40% in bonds without deciding whether that is short or long paper leaves the most important variable unset. The 60/40 portfolio behaved very differently depending on which end of the curve the 40 was sitting in.
Cash and short bonds are no longer a rounding error. With a policy rate near 3.5%, the short end pays something real for the first time in over a decade, and it pays it with almost no duration risk. That changes the arithmetic of holding money in cash — though the comparison that matters is against inflation, not against zero.
Long yields are a discount rate for everything else. When the ten-year moves, the present value of every distant cash flow moves with it, which is why long-duration equities react to bond moves that have nothing to do with their business. This is one of the main channels through which interest rates reach the rest of a portfolio.
The diversification assumption deserves rechecking. Bonds earned their place in balanced portfolios by rising when equities fell. That relationship depends on the shock being about growth. When the shock is about inflation or fiscal credibility, both sides can fall together — which is precisely what makes position sizing and risk management the part that does the work when correlation fails.
What none of this tells you
It is worth being explicit about the limits, because articles on this subject routinely overstate them.
Knowing that the term premium has risen tells you why yields are where they are. It does not tell you where they go next, and the professional forecasts quoted above disagree by a full percentage point on a twelve-month horizon.
Higher yields are not automatically bad for a bond investor either. If you hold to maturity, a higher yield means a higher return on new money — the loss is on the price of what you already own, the gain is on everything you buy from here. Which of those dominates depends entirely on your horizon, and that is a fact about you, not about the market.
And a curve that prices higher rates for longer has been wrong before, in both directions. The market is not a forecast; it is the price at which two sides with opposite views agreed to trade.
Frequently asked questions
Why do bond prices fall when interest rates rise?
Because a bond’s coupon is fixed at issue. When newly issued bonds pay more, an existing bond can only compete by selling at a lower price, so that its unchanged payments represent a higher return on the reduced purchase price. Nothing about the bond changes — only what someone will pay for it.
What is duration in bonds?
Duration measures how sensitive a bond’s price is to a change in yields. As a working rule, a bond with a duration of 8 loses about 8% of its price if yields rise by one percentage point, and gains about 8% if they fall by one. It is the number to look for on any bond fund factsheet, because it tells you the size of the risk you are taking.
If the central bank cuts rates, why did my bond fund fall?
Because the central bank sets the overnight rate and your fund most likely holds bonds of much longer maturity, whose yields are set by the market. Long yields reflect expected inflation, the expected path of policy over many years, and the term premium. Any of those can rise while the policy rate falls, and in 2026 they have.
What is the term premium?
The extra yield investors demand for holding a long-dated bond instead of rolling over short-term ones. It compensates for the uncertainty of committing money for a decade or more. It was near zero for much of the 2010s and has risen substantially, driven by heavy government issuance, inflation risk and policy uncertainty.
Are bonds a safe investment?
Government bonds carry very little risk that you will not be repaid, but that is not the same as price stability. A 30-year bond can fall by double digits in a year if yields rise, while a three-month bill essentially cannot. The credit is safe; the price is not, and how unsafe the price is depends almost entirely on duration.
Should I buy short-term or long-term bonds?
That is a horizon question rather than a market call. Short maturities give you the current yield with little price risk and reinvestment risk if yields fall. Long maturities lock in today’s yield for decades and deliver large gains if yields fall — and large losses if they rise. The honest answer depends on when you need the money, not on a forecast.
Why is the 10-year yield higher than the policy rate?
Because it prices something different: the average short-term rate expected over ten years, plus compensation for the uncertainty of that estimate. In mid-September 2026 the US 10-year closed at 5.01% against a policy range of 3.75%–4.00%, which says the market expects rates higher than today on average, demands a meaningful premium for the commitment, or both.
What this means in practice for an existing portfolio is a question of maintenance rather than forecasting: see how often you should rebalance, and why a higher-yielding bond sleeve changes what you are buying back into.
Related reading
- Is 60/40 still alive? — what the bond half of a balanced portfolio is actually for.
- The impact of interest rates on investment choices — how the discount rate reaches every other asset.
- Why savings lose value — the comparison that matters is against inflation, not against zero.
- How to manage risk in your investments — what to do when the diversification assumption stops holding.
- Position sizing and the risk of ruin — sizing a position by what it can lose, not by what it might return.
- Crisis-proof investments — which exposures behave differently when several assets fall together.
This article is general information, not personalised investment advice. It does not take into account the financial situation, objectives or risk tolerance of any individual reader, and the same text is distributed to all readers. Rate levels are a snapshot as of early September 2026 and change continuously; duration figures are illustrative approximations. Capital is at risk and past performance does not indicate future results.