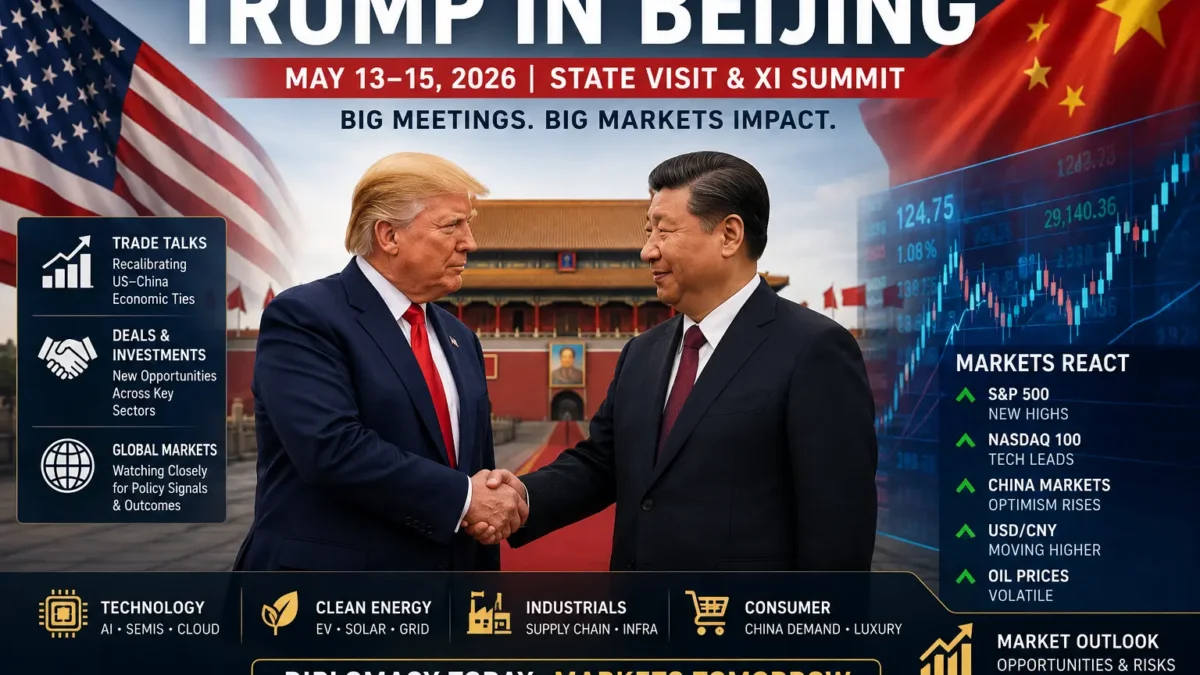
On the morning of May 14, 2026, President Donald Trump met President Xi Jinping at the Great Hall of the People in Beijing, opening a two-day summit that markets around the world have been pricing in for weeks. It is the first state visit to China by a sitting US president in nearly nine years, the last being Trump's own visit in November 2017, and it arrives at one of the most consequential moments for the global economy in recent memory. The two countries — together with the European Union — account for roughly 60% of global GDP, and the framework they set over these two days will shape trade, technology, and capital flows well beyond 2026.
For investors, this is not a story to watch passively on the news. The summit sits at the intersection of nearly every macro theme that matters right now: the fragile US–China trade truce struck in October 2025, China's tightening grip on rare earth exports, the unresolved Iran war and the Strait of Hormuz blockade, the AI race between the world's two largest economies, and the question of Taiwan. Each of these threads runs directly through portfolios — through semiconductor supply chains, energy prices, currency markets, defensive sectors, and the risk premium embedded in nearly every asset class.
This article breaks down what actually happened, what is on the table, what the early signals tell us, and — most importantly — how prudent investors should think about positioning a portfolio around an event whose outcome remains genuinely uncertain. The goal is not to predict the communiqué. It is to build a portfolio that performs reasonably across the range of plausible outcomes.
Understanding the market implications requires understanding the backdrop, because this summit is the product of a turbulent eighteen months in US–China relations rather than a standalone diplomatic event.
The relationship reached a low point in April 2025, when sweeping US tariffs — which at their peak pushed effective rates past 140% on some Chinese goods — triggered immediate retaliation from Beijing. China was the first major economy to strike back against what the administration branded its "Liberation Day" tariffs. Critically, Beijing did not respond only with counter-tariffs. It reached for what analysts have come to call its "break glass" tool: restrictions on the export of rare earth elements and the permanent magnets that depend on them. That move set off multiple rounds of escalating negotiation that ultimately produced a one-year trade truce in October 2025 — a truce now scheduled to expire in the fall of 2026.
Trump and Xi first met during Trump's second presidency at the Busan summit in late October 2025, a meeting that thawed relations enough to stabilize markets and led Trump to begin referring to the two countries as the "G2." The Beijing visit was originally planned for April 2026 but was postponed to May after the outbreak of the Iran war and the US and Israeli strikes that followed.
On arrival, the pageantry was visible but more restrained than the lavish 2017 reception, when Xi hosted Trump for a private dinner in the Forbidden City and unveiled some $250 billion in business deals. This time, the welcome ceremony and bilateral meeting at the Great Hall of the People carried what the White House called "tremendous symbolic significance," and Trump and Xi also visited the Temple of Heaven together. By the close of the first day, Beijing's official English-language readout stated that both sides had agreed to pursue a "constructive China–US relationship of strategic stability" as a guiding framework for the next three years and beyond. Xi, for his part, invoked the "Thucydides Trap" — the historical pattern in which a rising power and an established power slide toward conflict — and warned that mishandling the Taiwan question could put the relationship in serious jeopardy.
The framing matters for investors. A summit that produces a stated commitment to "strategic stability" is, at the margin, risk-positive. A summit overshadowed by explicit warnings about clashes and conflict is a reminder that the structural tensions have not gone away. Both things are true at once, and that is precisely why a single-outcome bet is the wrong way to position.
The summit agenda is broad, but five specific issues carry the most direct weight for portfolios. Each deserves its own assessment.
The most market-sensitive question is whether the October 2025 truce gets extended before its fall 2026 expiration. Traders heading into the summit broadly expected some form of truce extension, and the base-case expectation is that neither side wants the disruption of a renewed tariff spiral while both economies are absorbing the inflationary shock of the Iran war and elevated energy prices.
An extension would be incrementally positive for risk assets, particularly for multinationals with China-exposed supply chains and for sectors sensitive to input costs. A breakdown — or a failure to reach clarity before the deadline — would reintroduce a tail risk that markets have largely set aside since late 2025. The asymmetry here is worth noting: extension is mostly priced in, so the upside surprise is limited, while a negative surprise could move markets sharply. That asymmetry is a textbook case for understanding how to manage risk in your financial investments rather than chasing the consensus trade.
If tariffs are the headline, rare earths are the structural story. China dominates the global supply of rare earth elements and the permanent magnets built from them — inputs that underpin everything from semiconductors and electric vehicles to advanced defense systems. Even after the October 2025 truce, Chinese customs data has indicated that exports of several critical minerals remained roughly 50% below where they were in the twelve months before Beijing imposed export controls in April 2025.
Both sides have an interest in keeping these materials flowing, and a deal to stabilize rare earth exports is among the more plausible concrete outcomes of the summit. For investors, this theme cuts across multiple sectors. It touches semiconductor and AI-related equities, where magnet and chip supply chains are critical. It touches the clean-energy complex, since rare earths are essential to wind turbines and EV motors — a dynamic relevant to anyone holding ETFs focused on sustainable and green sector investments. And it touches the small universe of non-Chinese mining and processing companies, whose valuations swing sharply on every shift in the policy outlook.
The Iran war and the blockade of the Strait of Hormuz have driven a historic surge in energy prices, fueling inflation worries worldwide and weighing on global growth. The US has sought to pressure Beijing to help bring the conflict to a close, and China hosted Iran's foreign minister shortly before the summit — a development that briefly raised hopes of progress, sent oil prices lower, and lifted equities.
Most analysts caution that a breakthrough on Iran is unlikely to emerge directly from the Beijing talks; Beijing has played up its role as a global mediator while shying away from concrete commitments. For investors, the key point is that energy prices remain the transmission belt between geopolitics and inflation, and inflation remains the transmission belt between energy and central bank policy. Any summit signal that meaningfully changes the odds of de-escalation would ripple through oil, then through inflation expectations, then through bond yields and equity valuations. This is the same causal chain explored in our May 2026 market update on records, war, oil, and gold.
Artificial intelligence has become a central point of strategic competition. The US has produced cutting-edge AI models, but many remain expensive to run, while China has pressed its own advantages in deployment and cost. Export controls on advanced chips, the rare earths needed to manufacture them, and the broader question of technological decoupling all sit on the summit agenda. The presence of the Nvidia CEO in Trump's delegation underscores how tightly the AI supply chain is bound up in US–China diplomacy.
For investors already navigating an AI-driven equity market, the summit adds a geopolitical variable on top of the valuation questions raised by figures like Paul Tudor Jones. The interaction is important: an AI bull market that is also exposed to supply-chain and export-control risk is a different risk profile than one driven purely by earnings. Understanding both dimensions is part of developing a resilient investor mindset.
Taiwan is the issue most likely to generate genuine volatility, precisely because it is the area where the two powers' interests are least reconcilable. Xi's explicit warning about the consequences of mishandling Taiwan was the sharpest moment of the first day. Markets generally treat Taiwan as a low-probability, high-severity tail risk — the kind of event that does not affect day-to-day pricing but would dominate everything if it escalated. Given Taiwan's central role in global semiconductor manufacturing, any deterioration in the diplomatic temperature around the island is something portfolio risk managers monitor closely even when it is not driving headlines.
One underappreciated signal from this summit is the composition of the delegation. A group of prominent US executives joined Trump's trip, reportedly including the leaders of Tesla, Apple, BlackRock, Boeing, and Nvidia. The presence of these executives — particularly after a period in which engaging with Beijing had become politically sensitive for American companies — sends a signal that the business climate may be thawing.
Traders have specifically anticipated outcomes such as an extension of the tariff truce and large commercial purchases, including Boeing aircraft orders. Some analysts have speculated that Trump, who favors large headline announcements, could unveil a commitment by China to purchase a substantial additional volume of American goods. Whether or not a specific dollar figure materializes, the direction of travel matters: visible cooperation between the world's two largest economies tends to compress the geopolitical risk premium embedded in global equities, at least temporarily.
Investors should be careful, however, not to over-extrapolate from optics. Headline deal announcements have a history of looking larger at the podium than they prove to be in execution. The 2017 visit produced a reported $250 billion in deals, and the subsequent years nonetheless saw the relationship deteriorate into a full trade war. Optics are a real short-term market input, but they are not a substitute for the structural analysis that separates strategic from reactive investing.
Translating geopolitics into portfolio terms requires thinking through the transmission mechanisms for each major asset class. The summit does not move markets directly — it moves expectations, and expectations move prices.
Equities. A constructive outcome — truce extension, rare earth stability, visible cooperation — would tend to support global equities by reducing the risk premium, with particular benefit to multinationals, semiconductors, industrials with China exposure, and export-heavy sectors. A confrontational outcome would do the reverse, hitting the same sectors hardest. Within equities, the dispersion matters more than the index level: China-exposed names will move far more than domestically focused defensive sectors.
Bonds and rates. The summit's main channel into fixed income runs through inflation. If the talks reduce the odds of further trade disruption or improve the Iran outlook, inflation expectations could ease, which would be supportive for bonds. If they raise the temperature, the inflation-through-tariffs channel reopens. The relationship between these dynamics and yields is exactly why the impact of interest rates on investment choices remains one of the most important frameworks for any investor to internalize.
Commodities. Energy is the most summit-sensitive commodity, given the Iran overlay. Industrial metals and rare earths would respond directly to any supply-chain announcements. Gold, as a geopolitical and inflation hedge, tends to behave inversely to diplomatic progress in the short term — good summit news can soften the safe-haven bid, while a breakdown would strengthen it.
Currencies. The US dollar and the Chinese yuan are both directly in play. Trade and capital-flow expectations feed straight into the exchange rate, and a meaningful shift in the relationship's trajectory would register in currency markets quickly.
Sector dispersion. Perhaps the most actionable point: the summit's effect will be highly uneven across sectors. Semiconductors, clean energy, industrials, agriculture, defense, and aerospace each have direct exposure to specific summit outcomes, while utilities, domestic consumer staples, and healthcare are relatively insulated. This dispersion is the raw material for both risk and opportunity.
The single most important principle for navigating an event like this is also the most counterintuitive: the goal is not to predict the outcome correctly. The goal is to construct a portfolio that performs acceptably across the full range of plausible outcomes. Professional risk managers think in probability distributions, not point forecasts.
Summits generate a flood of real-time headlines, and each one tempts investors into reactive trades. The problem is that headline-driven trading is a structurally losing game for most individual investors: by the time a headline is on the screen, the market has often already moved, and the next headline frequently reverses the last one. The first day of this very summit produced both a cooperative joint readout and a sharp warning on Taiwan — a whipsaw in a single news cycle. Investors who trade each twist tend to accumulate transaction costs and behavioral errors. Understanding how emotions affect investment decisions is the first line of defense against this trap.
Genuine diversification means holding assets that respond differently to different summit outcomes. An equity-heavy portfolio concentrated in China-exposed multinationals is effectively a single directional bet on a good outcome. Adding defensive sectors, some fixed income, geographic diversification beyond the US–China axis, and a modest allocation to hedges creates a portfolio that does not depend on the summit going any particular way. This is the core logic behind crisis-proof investments and resilient sectors during periods of volatility.
The summit's tail risks — a breakdown on Taiwan, a collapse of the trade truce, an escalation rather than a de-escalation of the Iran war — are low-probability but high-severity. That profile is exactly what hedging instruments are designed for. Protective puts, defensive positioning, and selective exposure to assets that benefit from volatility can convert an unmanageable tail risk into a known, budgeted cost. The economics of effective investment hedging strategies always look unattractive in calm markets and indispensable in crisis markets — which is why they must be put in place before the crisis, not during it.
Position sizing is the discipline that determines whether a wrong call is a setback or a catastrophe. If a portfolio is so concentrated in summit-sensitive names that a confrontational outcome would cause a permanent impairment of capital, the position is too large regardless of how confident the investor feels. The correct size for any geopolitically exposed position is one where the bad outcome is survivable and the portfolio can wait for recovery. This principle connects directly to honestly assessing what type of investor you are and what level of drawdown you can actually tolerate.
Finally, it is worth remembering that summits are episodic and investing is continuous. The US–China relationship has moved through cooperation, confrontation, trade war, truce, and reset within a single decade. A long-term investor's job is not to win each episode but to compound steadily through all of them. The frameworks that make this possible — sound asset allocation, risk management, behavioral discipline, and the patience to let a diversified portfolio work — matter far more than the outcome of any single diplomatic meeting.
Beyond the immediate market reaction, the summit will sharpen several medium-term themes that thoughtful investors should track.
Supply-chain reconfiguration. Whatever the summit produces, the structural reality of China's dominance in rare earths and critical minerals will keep driving investment into supply-chain diversification — alternative mining jurisdictions, processing capacity outside China, recycling technologies, and substitution research. This is a multi-year capital-allocation theme, not a single trade.
Defense and strategic industries. The combination of the Iran war, Taiwan tensions, and critical-mineral vulnerability has elevated defense and strategic-industrial spending across multiple economies. This theme intersects with the broader category of emerging technologies in financial trading and the real economy.
The AI supply chain as a geopolitical asset. The AI race is no longer just a technology and earnings story; it is a national-strategy story. That reframing affects how investors should think about valuation, risk, and concentration in AI-related ETFs and individual semiconductor names.
Currency and reserve dynamics. Every major US–China summit feeds into the slow-moving conversation about the dollar's role, reserve diversification, and the long-term architecture of the global monetary system — a conversation that also touches the development of central bank digital currencies.
Volatility as a regime, not an event. Perhaps the most durable takeaway is that geopolitical volatility has become a persistent feature of the investing landscape rather than an occasional interruption. Portfolios built for the low-volatility 2010s need to be re-examined for a world where summits, conflicts, and trade disputes are recurring inputs. Tools like the Sharpe ratio help quantify whether a portfolio is actually being compensated for the risk it carries in this environment.
It is a two-day state visit and summit held in Beijing on May 14–15, 2026 — the first visit by a sitting US president to China in nearly nine years. It matters for investors because the US and China, together with the EU, account for roughly 60% of global GDP, and the summit's agenda covers trade, tariffs, rare earth supply chains, the AI race, the Iran war, and Taiwan — issues that flow directly into equity valuations, bond yields, commodity prices, and currency markets.
Heading into the summit, traders broadly expected an extension of the October 2025 trade truce rather than a comprehensive new deal, along with the possibility of large commercial purchases such as Boeing aircraft orders. Most analysts caution that a sweeping "grand bargain" is unlikely; the more realistic outcome is incremental stabilization. The first day produced a stated commitment from both sides to pursue a "constructive relationship of strategic stability," which is a positive framing, but the structural tensions remain unresolved.
The summit affects markets primarily by moving the geopolitical risk premium. A constructive outcome — truce extension, rare earth stability, visible cooperation — would tend to support global equities, especially China-exposed multinationals, semiconductors, and industrials. A confrontational outcome would hit those same sectors hardest. The effect is highly uneven across sectors, with domestic defensive sectors relatively insulated.
China dominates global supply of rare earth elements and the permanent magnets made from them, which are essential to semiconductors, electric vehicles, wind turbines, and advanced defense systems. After imposing export controls in April 2025, China's exports of several critical minerals remained roughly 50% below prior levels. A deal to stabilize these exports is one of the more plausible concrete summit outcomes and would affect technology, clean energy, and mining investments worldwide.
The prudent approach is generally not to make large directional bets on a specific summit outcome, but rather to ensure your portfolio is diversified enough to perform acceptably across the range of plausible results. That means avoiding excessive concentration in summit-sensitive sectors, maintaining geographic and asset-class diversification, considering hedges for tail risks, and sizing positions so that an adverse outcome is survivable.
The Iran war and the Strait of Hormuz blockade have driven energy prices sharply higher, fueling global inflation concerns. The US has pressed China to help bring the conflict to a close, and China hosted Iran's foreign minister shortly before the summit. However, most analysts believe a breakthrough on Iran is unlikely to come directly from the Beijing talks. Energy prices remain the key channel through which the conflict affects inflation, interest rates, and ultimately equity and bond valuations.
A delegation of prominent US executives — reportedly including the leaders of Tesla, Apple, BlackRock, Boeing, and Nvidia — joined the trip. Their presence signals a potential thaw in the US–China business climate after a period when engaging with Beijing had become politically sensitive for American companies. Investors should treat this as a meaningful but limited signal, since headline deal announcements have historically looked larger at the podium than they proved in execution.
Long-term investors should treat summits as episodic inputs rather than defining events. The US–China relationship has cycled through cooperation, trade war, truce, and reset within a single decade. The frameworks that drive long-term success — sound asset allocation, disciplined risk management, behavioral control, and patience — matter far more than correctly predicting any single diplomatic outcome. The objective is to compound steadily through all regimes, not to win each individual news cycle.
The Trump-Xi summit in Beijing is a genuinely significant event — the first US presidential visit to China in nearly a decade, convened at a moment when trade, technology, energy, and security tensions are all live simultaneously. The first day's commitment to a "constructive relationship of strategic stability" is a constructive signal, and the parallel warnings on Taiwan are a reminder that the structural rivalry has not been resolved and will not be resolved in two days.
For investors, the temptation is to treat the summit as a binary event to be traded — bullish on a deal, bearish on a breakdown. That framing is a mistake. The summit's outcome is genuinely uncertain, the headlines will whipsaw, and the real economic effects will unfold over months and quarters, not hours. The investors who navigate this well will not be the ones who guessed the communiqué correctly. They will be the ones whose portfolios were already built to withstand a range of outcomes: diversified across sectors and geographies, hedged against the tail risks, sized to survive the bad scenario, and anchored to a long-term plan that does not depend on any single meeting.
Geopolitical volatility is no longer an occasional interruption to a calm investing environment. It is the environment. The summits, the conflicts, the trade disputes, and the supply-chain shocks are recurring features of the landscape, and portfolios need to be constructed accordingly. The investor's edge in this world is not superior forecasting. It is superior preparation.
If you want to bring institutional-grade structure to a portfolio built for an era of persistent geopolitical risk — combining diversification, disciplined risk management, and data-driven analysis across every market regime — explore how AssetWhisper can transform your investment portfolio and discover the frameworks designed for exactly this kind of market.
Related Reading on AssetWhisper:
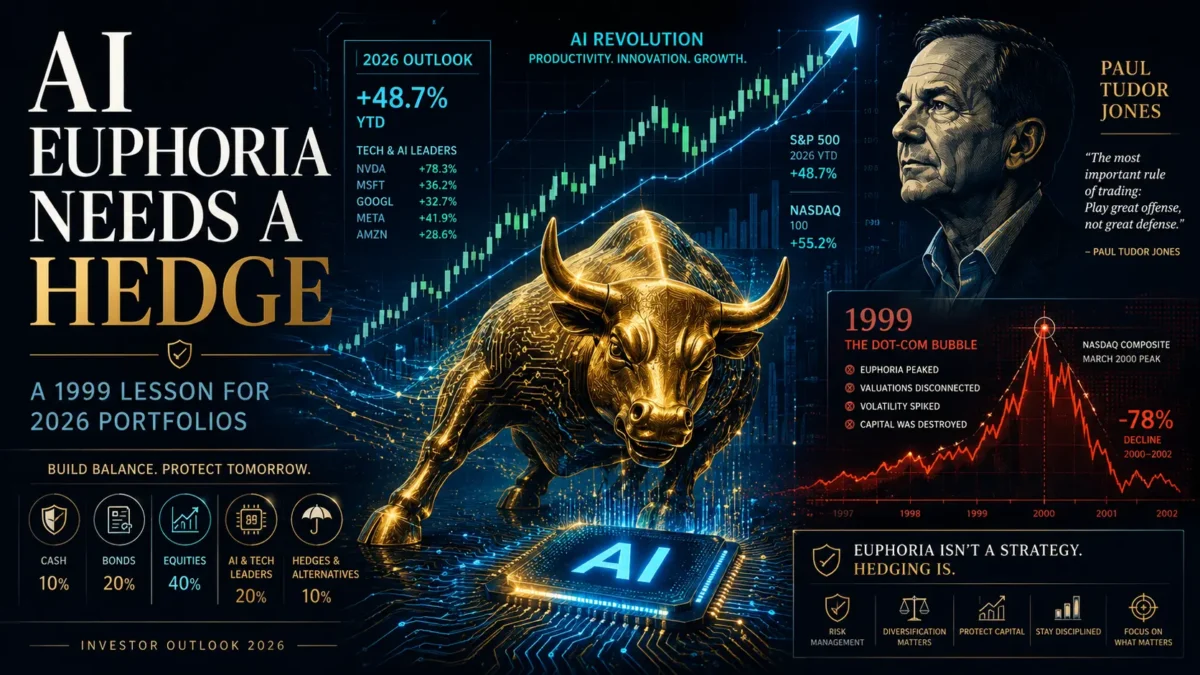
On May 7, 2026, billionaire hedge fund manager Paul Tudor Jones told CNBC's "Squawk Box" something that should make every investor pause: the artificial intelligence bull market still has another year or two of upside, but when it ends, the correction could be "breathtaking." He compared the current moment to October or November of 1999, roughly four months before the dotcom bubble peaked in March 2000. That comparison is not a casual remark from a market commentator. It is a calibrated warning from one of the most respected macro traders alive, and it arrives at a moment when the S&P 500 keeps printing records, the Nikkei 225 has just crossed 62,000 for the first time in history, and gold is trading above $4,700 per ounce as a hedge against the very turbulence Jones describes.
If you are an investor in 2026, you are facing a paradox that Jones himself embodies. He is bullish enough to be adding AI exposure to his own book. He is bearish enough to warn that the eventual unwind could resemble the worst tech crash in modern memory. How do you act on a thesis that says "ride the rally, but know the exit will be ugly"? That is exactly what this article unpacks. We will explore what Jones actually said, why the 1999 parallel cuts both ways, the four critical differences that make this cycle structurally different, and the concrete portfolio moves prudent investors are making right now to capture upside without being wiped out when the music stops.
The remarks that lit up financial media did not come from a permabear or a contrarian newsletter writer. Paul Tudor Jones is the founder and chief investment officer of Tudor Investment Corporation, a macro hedge fund firm that has navigated four decades of market cycles, including a famous call ahead of the 1987 crash. When a trader of that caliber draws a specific historical analogy on national television, professional risk managers listen.
Jones framed his thesis around two technological inflection points. The first comparison was to Microsoft's emergence as a dominant software platform in 1981, the early years of the PC revolution. The second was to the commercialization of the internet in the mid-1990s. He argued that the launch of advanced AI assistants, including Anthropic's Claude in January 2026 and OpenAI's continued evolution of ChatGPT, marks a similar productivity inflection. In his framing, both prior eras delivered roughly four to five and a half years of compounding equity returns once the productivity story took hold.
If that math is right, and if early 2024 marks a reasonable starting point for the current AI investment cycle, then we are roughly halfway through a multi-year bull run. That is the constructive part of the message.
The cautionary part of the message is what makes the comparison sharp. Jones specifically said the current environment, viewed through the lens of valuation multiples and earnings indicators, looks closer to October or November of 1999 than to the early phase of the internet boom. The dotcom market peaked on March 10, 2000. By that calendar, today's investors might be operating in a window where most of the easy gains lie ahead but the late-stage froth, melt-up, and eventual top are also coming into view.
Jones laid out a specific quantitative scenario. If the U.S. stock market climbed another 40% from current levels, the ratio of total stock market capitalization to gross domestic product would reach somewhere between 300% and 350%. That would dwarf the 2000 peak, when the same ratio reached approximately 140%, and it would create the conditions for what Jones called a "breathtaking" correction. Risk managers know that drawdowns from extreme valuation levels tend to be both deeper and longer than declines from normal valuations.
The detail that truly defines Jones's thesis is what he is doing with his own capital. Despite warning of a potentially historic correction, he confirmed that he has recently increased his AI-related positions. As a self-described macro trader, he buys baskets rather than picking individual names, and his stated belief is that he can navigate the eventual exit. This is the calculus of a professional who trusts his own ability to read the cycle and act before retail investors realize the regime has changed.
For most individual investors, replicating that approach without institutional infrastructure is risky. The lesson is not "do exactly what Jones is doing" but rather "respect the thesis and build a portfolio that survives even if you cannot perfectly time the exit." That is where behavioral discipline and proper risk frameworks become decisive.
Pattern recognition is one of the most useful skills in markets, and the surface similarities between today's AI rally and the late 1990s are real. Skeptics are not making them up. Acknowledging the parallels honestly is the first step toward acting on them rationally.
Index concentration in a handful of mega-cap names. In 1999, a small group of technology stocks drove a disproportionate share of the Nasdaq's gains. In 2026, the so-called Magnificent 7 collectively account for an unprecedented share of S&P 500 market capitalization, and the AI infrastructure subset of that group is even more concentrated. When a market relies on a narrow leadership group, it becomes vulnerable to sentiment shifts in just a few names.
Narrative dominance. During the dotcom era, attaching ".com" to a company name was enough to lift its valuation. Today, mentioning AI in a strategy update, a product roadmap, or even a SaaS pitch deck triggers a similar valuation premium. When the descriptive label of a sector starts to function as a magic word that suspends normal scrutiny, that is a textbook late-cycle behavior.
Vendor-financed mega-deals. The 1990s telecom boom saw equipment vendors lend money to customers so those customers could buy more equipment, inflating reported revenues. Today's headlines about multi-billion-dollar partnerships in which chipmakers, hyperscalers, and AI labs cross-invest in each other have raised the same kind of eyebrows from credit analysts. Whether these arrangements are economically sound or accounting theater will determine a lot about what survives a downturn.
Retail euphoria and IPO behavior. The dotcom era was defined by first-day IPO pops of 58% to 73% on average, with most listed companies reporting losses. The 2026 environment has not yet matched those extremes, but private market valuations for AI startups, the velocity of secondary share sales, and the willingness of retail investors to buy single-name AI exposure on margin all rhyme with the speculative tone of late-stage bull markets. Recognizing these signals is one of the most common mistakes in stock market investing that even experienced participants overlook.
Cycles rhyme but they do not repeat exactly, and the case that this AI cycle is structurally healthier than 1999 is not just bullish hand-waving. It rests on four observable differences in earnings, infrastructure, addressable market, and macro backdrop.
Earnings are real and concentrated in profitable platforms. The dotcom poster children were burning cash to fund customer acquisition and hoping that a viable business model would emerge before the runway ran out. The 2026 AI infrastructure leaders, by contrast, are reporting tens of billions of dollars in quarterly revenue, expanding gross margins, and free cash flow that funds continued capital expenditure. The difference between selling shovels in a real gold rush and selling maps to a hypothetical gold field is exactly the difference between most AI infrastructure plays today and most dotcom darlings then.
Capital expenditure is physical and useful. A massive share of AI investment in 2026 is going into data centers, electrical grid upgrades, and chip fabrication facilities. Even in a severe correction scenario, that physical capacity does not evaporate. The dotcom era similarly funded a buildout of fiber optic capacity that, after the crash, became the substrate for the next decade of internet growth. Today's data center boom is following the same pattern, only at a far larger physical and energy scale.
The addressable market is bigger by an order of magnitude. Internet adoption in 1999 was largely about replacing offline information transfer with online equivalents. AI in 2026 is positioned to automate cognitive labor across the entire knowledge economy, which represents a far larger pool of value than software spending alone. Some research has suggested AI's total addressable market could reach roughly 11 times the historic scale of IT spending, because it extends into labor productivity rather than just IT budgets.
The macro backdrop is more nuanced. The Federal Reserve has held its benchmark rate at 3.50%–3.75% through three consecutive 2026 meetings, a level that constrains speculative excess in a way that the much lower rates of the late 1990s did not. At the same time, the prospect of incoming Fed leadership and a midterm election cycle could limit aggressive tightening, creating a cushion that did not exist in earlier corrections. Understanding how interest rates shape investment choices is critical to interpreting how this backdrop will evolve over the next twelve to eighteen months.
Putting concrete figures around the macro thesis turns it from abstract narrative into something investors can stress-test against their own portfolios. Three metrics deserve particular attention right now.
The first is the market capitalization to GDP ratio, often called the "Buffett Indicator" because Warren Buffett once described it as the single best measure of equity valuation. A ratio approaching 200% has historically been associated with rich valuations. The 300%–350% range Jones described would be unprecedented in modern U.S. financial history. Reaching that level would imply either extraordinary earnings growth ahead or a dramatic divergence between asset prices and economic output, the latter being exactly what defines a bubble.
The second is index concentration. When the largest five or ten constituents of an index drive the majority of returns, the index becomes a leveraged bet on those few names rather than a diversified market exposure. Investors who believe they are diversified by holding a broad U.S. equity index in 2026 should look closely at the underlying weightings before assuming their portfolio reflects the economy.
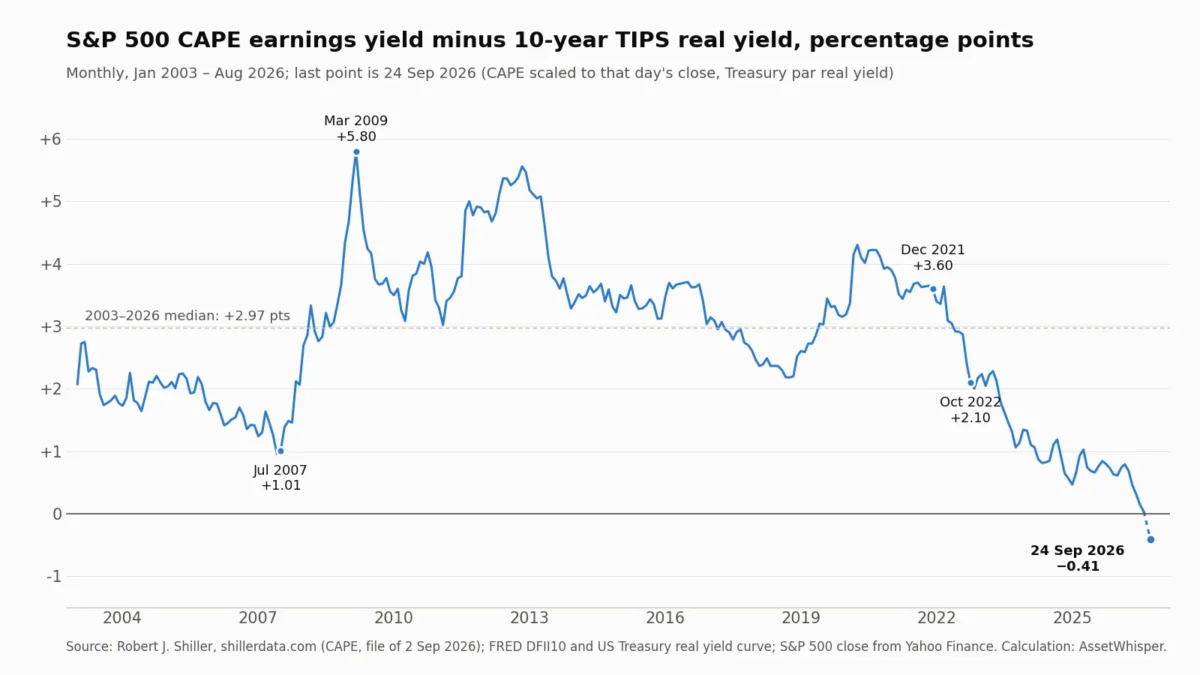
The third is forward earnings yield versus risk-free rates. In 1999, the spread between the S&P 500 earnings yield and 10-year Treasury yields had collapsed to historically low levels, signaling that equities offered little compensation for taking on risk. Tracking that spread in 2026 — and comparing it to the levels that historically preceded major drawdowns — is one of the more reliable warning systems available to long-term investors. Tools like the Sharpe ratio can help quantify whether the return investors are receiving justifies the risk they are taking on at any given valuation level.
Reading Jones's thesis as "the rally is over, sell everything" would be a misreading. Reading it as "buy the dip, AI to the moon" would be equally wrong. The actionable interpretation sits in the middle: stay invested in the productivity revolution, but engineer your portfolio so a 40%–60% drawdown in concentrated AI exposure does not destroy your long-term financial plan.
The single most expensive mistake an investor can make in a late-stage bull market is to sell everything months before the actual peak. The dotcom era produced a long list of investors who exited in 1998, missed the final melt-up, and then watched in frustration as their target prices were left behind. The pain of missing returns is real, and most people who try to come back in do so too late. Jones himself is adding AI exposure precisely because he respects the cost of being out of a parabolic move. The discipline is to participate, not to abstain.
Concentrated AI exposure can coexist with broader diversification. That means meaningful allocations to non-U.S. equities, where valuation multiples remain more reasonable, and to asset classes that historically perform well during equity drawdowns. Gold above $4,700 per ounce is signaling that institutional investors are already taking this seriously. Considering crisis-proof investments and resilient sectors is not bearish positioning — it is portfolio insurance that lets you stay in the AI trade with confidence.
Position sizing is the most underrated discipline in retail investing. If a single AI stock is 30% of your portfolio, a 60% decline in that stock is a 18% drawdown to your total wealth — recoverable but painful. If the same stock is 5% of your portfolio, the same decline is a 3% drawdown, almost invisible against normal market noise. The same upside conviction can be expressed at very different risk levels depending on how the position is sized. Building a coherent risk management framework is what separates investors who survive multi-year regimes from those who do not.
For investors with meaningful AI exposure, hedging instruments such as protective puts, collar strategies, and inverse exposure to concentrated indices can convert tail risk into a known, manageable cost. The economics of hedging are unfavorable in calm markets — premiums look expensive when nothing seems to be happening. The economics of hedging are extraordinary in crisis markets — exactly when investors most regret not having the protection in place. Building familiarity with effective investment hedging strategies before you need them is a hallmark of serious portfolio construction.
The 2000–2002 unwind of the Nasdaq, which saw the index fall by roughly 78% from its peak, generated a number of durable lessons that remain valid in any concentrated bull market.
The first is that survivors and victims often look identical at the peak. Amazon, eBay, Cisco, and many other recognizable winners of the post-crash era saw their stock prices collapse 80% or more during the bear market. The companies survived; many investors holding them at peak valuations did not. Distinguishing between a great business and a great stock at a particular price is the central skill that separates strategic from speculative investors.
The second lesson is that liquidity vanishes when you most need it. During the worst stretches of the dotcom unwind, bid-ask spreads widened, certain securities effectively could not be sold at any reasonable price, and margin calls forced sales at the worst possible moments. Investors who used leverage discovered that their effective risk was much higher than they had modeled. Anyone running margin in 2026 should stress-test their position against a 40% peak-to-trough decline in their largest holdings.
The third is that the next bull market emerged from completely different leadership. The post-2002 recovery was led by financials, energy, materials, and emerging markets, not by the survivors of the prior cycle. Investors who anchored their thesis to "tech will lead again" missed an entire decade of returns elsewhere. The implication for 2026 is to stay open-minded about where the next leadership group emerges, even while continuing to participate in the AI cycle. Identifying undervalued assets outside the consensus theme is exactly the discipline that pays off after major regime changes.
Direct stock picking in AI infrastructure names is not the only way to express a bullish thesis on the cycle, and in many cases it is not the most prudent way. Investors building positions today have several diversified vehicles available that can capture the upside while mitigating single-name risk.
Thematic ETFs covering AI and automation. Diversified AI-focused ETFs provide exposure to the broad supply chain — chip design, foundry capacity, software platforms, data center REITs, electrical infrastructure — without requiring the investor to pick which specific company within each layer will dominate. This is closer to the basket approach Jones himself describes using.
AI-driven portfolio management. A growing share of capital is being managed by autonomous AI trading agents and algorithmic trading strategies that use machine learning to dynamically adjust exposure based on market conditions. The same technology that is fueling the bull market is also being deployed to manage risk within it. For investors comfortable with quantitative approaches, this represents a way to participate in the productivity revolution from both sides — as an investor in AI and as a user of AI-powered allocation.
Tactical algorithmic exposure. Even traditional investors are increasingly augmenting their core holdings with profitable algorithmic trading strategies that systematically harvest factors such as momentum, low volatility, and quality. These factor-based approaches have historically held up better during sharp index drawdowns than passive market-cap-weighted exposure, because their underlying screens tend to rotate away from the most overvalued names automatically.
The common thread across all three approaches is that they replace single-name conviction with system-driven diversification. In a market where the leadership names could fall 60%–80% in a correction, replacing concentration with structure is not bearish — it is strategic.
Late-stage bull markets are not primarily defeated by bad analysis. They are defeated by predictable psychological patterns that distort otherwise capable investors into making decisions they later cannot defend. Understanding these patterns is the closest thing to an investing superpower available to anyone.
Fear of missing out (FOMO) drives investors to chase performance into already-extended stocks, typically at the worst possible entry points. The pain of watching peers profit from a name you avoided is psychologically real, but it is not a basis for an investment thesis. Setting predefined entry rules — and respecting them even when sentiment is screaming louder — is the antidote.
Recency bias convinces investors that the recent past will continue indefinitely. After a year of strong AI returns, the brain extrapolates linearly: "this will keep working." Markets do not work that way. The probability of mean reversion increases with the duration and magnitude of the prior move, not the other way around.
Confirmation bias filters out information that contradicts an existing thesis. Investors who are heavily long AI tend to read more bullish AI commentary, follow more bullish AI commentators, and subconsciously dismiss bearish data points. Actively seeking out the strongest counterargument to your own positioning — and engaging with it seriously — is a discipline that improves outcomes more than any technical indicator.
Anchoring locks investors onto historical purchase prices, leading to decisions like refusing to sell a winner because "it has already gone up so much" or refusing to sell a loser because "it has to come back to my entry." The market does not know what you paid. Decisions should be made based on forward expected returns from current prices, not on the path that brought a position to its current level.
A deeper understanding of how emotions affect investment decisions and how to develop a successful investor mindset is, in many ways, more valuable in 2026 than any specific market call. The investors who navigate the next two years successfully will be the ones who control their behavior, not the ones who predict the exact peak.
The honest answer is that it shares characteristics with historical bubbles — index concentration, narrative dominance, stretched valuations in select names — but it also has characteristics that prior bubbles lacked, including profitable cash-generating leaders and massive physical infrastructure investment. Whether the cycle ends in a 1999-style crash or a more orderly multi-year consolidation will depend on how earnings evolve relative to expectations over the next twelve to twenty-four months.
Jones himself is not selling — he is adding to AI positions while warning about the eventual exit. The rational response for most investors is not to exit but to ensure their AI exposure is appropriately sized, diversified, and complemented by hedges or non-correlated assets. Selling everything at the first warning is how investors miss the final, often largest, leg of bull markets.
The ratio compares the total value of publicly traded equities to the size of the underlying economy. Historically, ratios above 100% have indicated rich valuations and ratios above 150% have preceded notable corrections. A ratio of 300%–350% would imply that equity prices reflect roughly three times the annual output of the U.S. economy, a level that has no historical precedent and that would require either extraordinary earnings growth or a major reset to bring back into normal range.
The most important structural differences are real earnings, real infrastructure, and a much larger addressable market. Today's leading AI companies are reporting tens of billions of dollars in actual quarterly revenue, building physical data center and grid capacity that has lasting value, and addressing markets that include knowledge labor across the entire economy rather than just IT spending. None of this guarantees that valuations cannot correct severely, but it does suggest that the long-term productivity story is more robust than what underlay the 1999 rally.
The most effective protections are structural rather than tactical: appropriate position sizing, asset class diversification beyond U.S. tech, allocations to defensive sectors and gold, and selective use of options-based hedges for the portion of the portfolio where you are unwilling to accept full drawdown risk. Trying to perfectly time the top is far less reliable than building a portfolio that survives the top no matter when it comes. Reviewing strategies to invest in financial markets the right way is a useful starting point.
Jones described the cycle as roughly 50%–60% complete and suggested another year or two of upside before the eventual peak. Notably, prediction market data referenced in some recent reporting has placed the implied probability of an AI-driven market crack-up by the end of 2026 at only around 21%, broadly consistent with Jones's view that the cycle still has runway. Of course, prediction markets are sentiment indicators, not forecasts, and the timing of major regime shifts is notoriously hard to pin down.
Diversified AI ETFs carry less single-name risk than concentrated stock positions, which is genuinely valuable in late-cycle environments where any individual leader could underperform sharply. They are not, however, immune to systemic AI-sector drawdowns, since their constituents are often correlated. ETFs are a tool for managing single-name risk, not for eliminating sector risk.
The answer depends on personal risk tolerance, time horizon, and existing portfolio composition. A useful framework is to size AI exposure such that a 50% drawdown in that segment would be uncomfortable but not catastrophic for your long-term goals, then complement it with allocations to international equities, fixed income, defensive sectors, and tangible assets. Tools like technical and fundamental analysis can help refine entry and exit decisions within each segment.
The most useful framing of Paul Tudor Jones's warning is not "the AI bull market is a bubble" but rather "the AI bull market is a real productivity cycle that is now entering its more dangerous phase." Both halves of that sentence matter. Investors who only hear the first half will exit too early and miss substantial returns. Investors who only hear the second half will stay too long and surrender those returns in a brutal mean reversion.
The right posture for 2026 is one of strategic optimism: stay invested in the productivity revolution, but engineer your portfolio so that you can survive a 1999-scale correction if and when it arrives. That means appropriate position sizing, real diversification, deliberate use of hedges, and — most importantly — the behavioral discipline to follow your own rules when sentiment is screaming the loudest.
History is not a script. The 1999 parallel could play out within months, drag on for years, or never fully materialize because the underlying earnings story turns out to be stronger than the skeptics expect. What history reliably teaches, however, is that the investors who navigate full cycles successfully are not the ones who predict the future best. They are the ones who build portfolios robust enough that the future does not need to be predicted in order to compound wealth steadily.
If you are ready to bring institutional-grade structure to your investment approach — combining AI-driven analysis, disciplined risk management, and a long-term portfolio framework — explore how AssetWhisper can transform your investment portfolio and discover the systems we use to position for both upside and resilience in markets exactly like this one.
Related Reading on AssetWhisper:
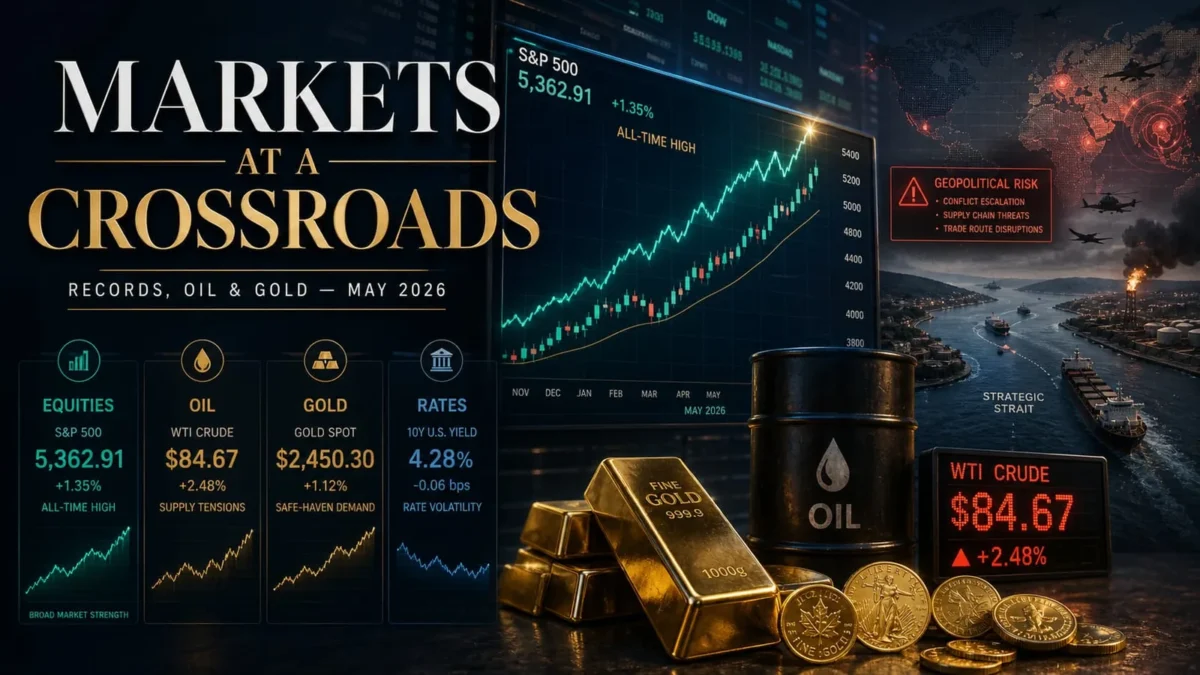
May 2026 opens with one of the strangest setups in recent market memory. The S&P 500 closed Friday at 7,230.12, the Nasdaq Composite ended at an all-time high of 25,114.44, and the Dow slipped 152.87 points to settle at 49,499.27. Both leading benchmarks printed fresh closing records on the same day that the U.S. national average for retail gasoline hit $4.39 per gallon — roughly 50% above pre-conflict levels — and WTI crude was trading near $102 per barrel.
A war is on. The Strait of Hormuz has been contested for almost three months. Gold has spent the year oscillating in a range above $4,600. The 10-year Treasury yield is at 4.39%. And U.S. equities just delivered their strongest April since 2020.
If you find that combination disorienting, you are not alone. Markets are pricing in a very specific version of the future — one in which corporate earnings keep climbing, the Federal Reserve eventually cuts rates again, and the geopolitical conflict resolves without a recession. Each of those assumptions is reasonable on its own. Together, they leave very little room for error — and as we'll see, the Fed itself is openly divided on the path forward in a way it has not been since 1992.
This briefing walks through what is actually happening — the records, the war, the earnings surprise, the historic Fed dissent, the commodity moves, the Spirit Airlines collapse, and the cracks beneath the surface — and translates each of them into specific positioning decisions you can make in your own portfolio.
It pairs naturally with our recent pieces on AI Trading Agents (the technology layer running underneath this rally), the GENIUS Act and Stablecoin Regulation (where the dollar is going), and Crisis-Proof Investments (which sectors actually hold up when narratives shift).
Let's start with the snapshot. As of the May 1, 2026 close:
April 2026 was the best month for the S&P 500 since 2020. That is the headline most investors will see. The deeper context — and the reason it is happening despite a shooting war — is what matters.
Strip out the geopolitics and one fact dominates the tape: corporate earnings did not just beat — they crushed. And the magnitude of the beat changed materially in the final week of April.
A month ago, analysts expected Q1 2026 S&P 500 earnings to grow roughly 14%. A week before May 1, the consensus had moved up to about 16%. Then Big Tech reported. Alphabet, Meta, Amazon, and Microsoft printed on Wednesday, Apple on Thursday — and by Friday's close, LSEG IBES data showed Q1 S&P 500 earnings growth tracking at 27.8%, the strongest pace since the fourth quarter of 2021. FactSet's blended figure put the same number at 27.1%, with seven of eleven sectors posting double-digit growth.
That is not a normal upgrade. Mid-cycle earnings revisions of that magnitude — more than a full doubling of the expected growth rate inside two weeks — are extraordinarily rare, and they are the single most important reason the index is at all-time highs in the middle of an oil shock.
Three drivers stand out underneath the headline number:
The AI capex cycle is real and broadening. Caterpillar beat earnings expectations and pointed to a record backlog and surging demand for power generation equipment from AI data centers. A construction-and-mining bellwether telling you the AI buildout is what's driving its book is the kind of cross-sector confirmation that earnings models routinely miss. We covered the broader theme in Artificial Intelligence ETFs and the operational side in AI Trading Agents — but the takeaway here is simpler: AI is no longer just a software story, it is a capex story for industrials and utilities too.
Apple delivered the cleanest print in years. Apple jumped roughly 3% Friday after reporting its strongest quarterly sales growth in over four years, driven by demand for the iPhone 17 lineup. A clean print from the largest stock in the index resets sentiment for the entire mega-cap complex.
The energy sector is doing the heavy lifting on revisions. Edward Jones noted that the upward revision to 2026 earnings has been driven largely by a nearly 40% increase in expected earnings per share for the energy sector, reflecting the higher oil-price backdrop. Materials and technology have also seen 2026 earnings estimates rise by more than 11%. In other words, the Iran war is not just a risk — it has materially reshaped which sectors are leading the year.
That is the rotation worth watching. Equity markets in 2025 were heavily driven by the artificial intelligence trade, and 2026 is starting to show a rotation toward segments that had been overlooked.
The conflict began in late February 2026 and has produced the kind of contradictions that always emerge when geopolitical shocks meet a strong earnings backdrop. Equities have shrugged off the disruption faster than anyone expected.
According to Mercer Advisors, the major averages dipped on the start of the U.S. war with Iran but all three indexes are now trading well above where they began 2026, with the firm describing itself as still strategically bullish on equities even if the conflict persists.
The market's logic, as best we can read it: the energy disruption is real but partially offset by U.S. Strategic Petroleum Reserve releases (172 million barrels coordinated with more than 30 nations), Jones Act waivers, and EPA fuel-blending flexibility; the Strait of Hormuz situation is bad for shipping but has not produced a global supply shock equivalent to 1973 or 1990; and U.S. corporate earnings, particularly in technology, are durable enough to absorb the macro hit.
Where this is most visible is in oil-sensitive earnings. Exxon and Chevron both beat quarterly earnings expectations but reported sharp drops in profits, with Exxon's net income down roughly 45% and Chevron's down 36%. That is a reminder that even integrated oil majors do not benefit linearly from higher crude — refining margins, currency effects, and write-downs all complicate the picture. The simple "war pushes oil up, oil stocks up" trade is not how 2026 has actually played out for the giants.
Where it has played out is in equipment, services, and select energy infrastructure. Power generation, pipelines, and refiners with the right product mix have been the cleaner trade. This is exactly the granular sector analysis we cover in Crisis-Proof Investments: Resilient Sectors in Times of Volatility — because crisis-resilience is rarely about the obvious sector and almost always about the sub-segment.
The other piece is gasoline. The U.S. national average for retail gasoline hit $4.39 per gallon on May 1, up roughly 50% — about $1.50 per gallon — from late February, with prices ranging from $3.38 in Oklahoma to over $5.83 in California and exceeding $6 in some California metros. That is a real-economy tax on consumers, and it is starting to show up in the consumer discretionary tape — which is a clean reason the Dow underperformed the Nasdaq on Friday and why staples and discretionary earnings estimates have been revised lower for 2026 even as the index aggregate has been revised higher.
Monetary policy is normally a story about what the Fed does. In April 2026 it became a story about how openly the Fed disagrees with itself.
At the April 29 meeting — Jerome Powell's last as Fed Chair before his term expires May 15 — the FOMC voted 8-4 to hold rates in the 3.50%–3.75% target range. That single number is the most important Fed development of the year so far. The last time four FOMC members dissented at a single meeting was October 1992. This was not a routine pause; this was the most divided U.S. central bank in over three decades, in the final meeting of an outgoing chair, with a successor (former Fed Governor Kevin Warsh) already nominated and clearing key procedural votes in the Senate.
The four dissents split in opposite directions, which is the part that matters for portfolio construction:
The trio's reasoning was unusually direct. Hammack noted that rising oil prices add to broad-based inflationary pressures and create upside risks to inflation alongside downside risks to growth. Logan, dissenting for the first time since becoming Dallas Fed president in 2022, argued that prolonged supply disruptions from the Middle East could plausibly justify either a cut or a hike as the next move. Kashkari pushed back on issuing forward guidance at all under current uncertainty.
Powell himself, asked at the press conference whether he was handing a divided Fed to his successor, framed the moment in terms of the four supply shocks the central bank has absorbed in five years: the pandemic, the Ukraine invasion, the tariff regime, and now Iran. The answer was a polite acknowledgment that there is no consensus on what the next move should be — and that the new chair will inherit that lack of consensus.
For investors, the practical implications are concrete and slightly different from a week ago:
We have a deeper framework for this in The Impact of Interest Rates on Investment Choices, and the principle is unchanged: rate regimes shift portfolio construction more than narratives do, and a divided central bank is itself a regime change.
Here is a number that should make every investor pause. Gold delivered roughly 60%+ returns in 2025, crossing $4,000 per ounce for the first time in October. It then extended the move into early 2026, reaching as high as the $5,400s in late January before suffering a sharp pullback — falling roughly 14% in three days in early February — and settling into a wide range that has held above $4,600 through April.
Three reinforcing forces are driving this:
Central banks keep buying. J.P. Morgan Global Research projects investor and central bank gold demand to average around 585 tonnes per quarter in 2026, comprising roughly 190 tonnes per quarter from central banks plus 330 tonnes per quarter in bar and coin demand and around 250 tonnes of expected ETF inflows over the year. That is structural demand independent of any short-term price catalyst.
The dollar has weakened. The dollar continues to drift lower against a basket of trade-weighted currencies, with the rally seen in March after the outbreak of the Iran conflict having faded. A softer dollar makes gold cheaper for the rest of the world and reinforces the bid.
Geopolitical risk is no longer being treated as transient. Even with constructive Iran negotiation headlines, the safe-haven premium has not unwound. The market is pricing elevated geopolitical risk as a new normal rather than a temporary spike.
The forecast picture is unusually wide. J.P. Morgan Global Research projects gold to average $5,055 per ounce in the final quarter of 2026 and around $5,400 by the end of 2027. Société Générale has called for $6,000 per ounce by year-end, while Morgan Stanley has flagged a $5,700 bull case.
This is not a "buy gold" call. It is a recognition that gold has moved structurally and that any portfolio that ignores it is taking a more concentrated bet on dollar-denominated risk assets than its owner probably realizes. We laid out the framework in Effective Strategies for Investment Hedging, and the practical question for May 2026 is not whether to own gold but how much. For most diversified portfolios, a 5%–10% allocation now does meaningfully different work than it did when gold was at $2,000.
A volatility caveat worth repeating: gold lost 14% in three days in early February. It is no longer the slow, steady store-of-value asset of the post-2013 era. Position size accordingly.
Markets at all-time highs always look invincible until they don't. Three specific cracks are worth tracking through May.
Equity risk premium near zero. As 2026 began, the S&P 500's forward earnings yield was nearly identical to the 10-year U.S. Treasury yield, leaving an equity risk premium of about 0.02% — among the lowest readings on record. Translation: investors are accepting equity volatility for essentially the same yield they could earn risk-free. That is not by itself a sell signal, but it is the textbook condition where downside surprises hit hardest.
Concentration is still extreme. Over the last three years, mega-cap growth stocks have driven an 86% total return for the S&P 500 versus 43% for the equal-weight index — a gap last seen during the late-1990s tech bubble, fueled mostly by multiple expansion rather than superior earnings growth. The 2026 broadening is happening, but slowly, and the index-level performance still hides a lot of dispersion.
Spirit Airlines just ceased operations. In the early hours of Saturday, May 2, Spirit Airlines announced an immediate orderly wind-down after a $500 million government rescue package fell through, becoming the first major U.S. airline to go out of business for financial reasons in 25 years. Approximately 17,000 jobs are affected, including 14,000 Spirit employees. Spirit Aviation Holdings shares, which fell more than 62% on Friday to 52 cents, are now in liquidation mode. Roblox, separately, tumbled 24% on Friday after slashing its 2026 bookings guidance from a prior range of $8.28–$8.55 billion down to $7.33–$7.6 billion, citing short-term friction from age-based accounts and content monitoring changes.
Both are reminders that index-level records do not protect individual positions from idiosyncratic risk. Spirit was bleeding cash long before Iran, but the war's impact on jet fuel prices was the final blow. Even a multi-year warning sign can resolve abruptly.
These are exactly the kinds of dynamics we frame in Common Mistakes in Stock Market Investing. The most expensive mistake at all-time highs is not sitting out the rally — it is treating "the market is up" as a substitute for thinking about specific holdings.
The goal of a market update is not just to describe what happened — it is to translate it into action. Here is a practical framework for the next 30 to 60 days, adapted to where you sit.
You probably should not change much. The base case — earnings growth that beat dramatically in Q1, a Fed that ultimately delivers at most one cut this year, and equity records that broaden into more sectors — supports staying invested. The calibration matters more than the direction.
Three small adjustments that pay off in this regime:
This is a tape that rewards earnings-driven momentum and punishes positioning against it. Keep stops tight on overextended winners (a record close is not a reason to add; it is a reason to manage). Watch the energy and materials sectors for the cleaner expression of the geopolitical premium — direct oil-major exposure has been a less efficient trade than equipment, refiners, and select midstream names this cycle. The Spirit collapse is a fresh case study in how single-name risk compounds.
For risk-adjusted comparisons, the discipline in The Sharpe Ratio: History, Applications, and Calculations is more useful right now than headline returns.
This is the hardest spot in the cycle. All-time highs feel like the worst possible entry point. They are not, statistically — but they do mean that how you enter matters more than whether you enter.
Dollar-cost averaging over six to twelve months remains the boring, correct answer. Pair it with a clear written plan: target allocation, rebalancing thresholds, and rules for what you will and will not do during the next 10% drawdown. The plan written in calm beats every plan extemporized in panic. We unpack the full mindset in How to Invest in the Financial Market the Right Way.
The recession narrative has not gone away. Soft labor data, sticky service inflation (March headline CPI rose 3.3% year over year, the highest since May 2024), and the political risk around the Fed Chair transition all remain on the watch list. Oppenheimer specifically called out a soft labor market and the upcoming Fed Chair selection as factors that could introduce policy uncertainty later in 2026.
If that is your dominant concern, the answer is not to sell broad equities. It is to upgrade quality. Lean into companies with strong balance sheets, durable cash flow, and pricing power; reduce exposure to high-multiple stories that need everything to go right; keep some dry powder in short-duration Treasuries earning above 4%. This is the same principle we teach in How to Manage Risk in Your Financial Investments — risk management is composition, not timing.
The narrative changes that would actually move markets in the next 30 days are concentrated:
The Iran negotiation track. Reports indicate that Iran sent its response through Pakistani mediators to the latest U.S. amendments to a draft agreement aimed at ending the conflict. A genuine breakthrough would crush oil, lift consumer discretionary, and potentially trigger a sharp move in gold. A breakdown does the opposite. Position for both, because the headline risk is binary.
The Powell-to-Warsh transition. Powell's term as chair ends May 15 and Kevin Warsh has been advancing through Senate confirmation. With three regional Fed presidents now publicly opposed to dovish forward guidance, Warsh's first communications — and any ability to build consensus quickly — are now a market variable in their own right. Watch for any signal on whether the new chair leans toward Miran's dovish view or toward the Hammack/Kashkari/Logan caution.
Tier-two earnings and consumer data. The mega-caps reported strongly. The next two weeks bring the consumer companies, the industrials' supply chain commentary, and the regional banks' loan books. That is where you find out whether the rally is a small-handful-of-winners story or a genuine broadening — and whether $4.39 gasoline is starting to bite consumer balance sheets.
Every framework in this update — the earnings revisions, the Fed dissent dynamics, the sector rotation, the gold positioning, the Iran-scenario stress tests, the Spirit-style single-name risk — is what AssetWhisper's research stack synthesizes for you on an ongoing basis.
Our weekly market reports combine real-time data ingestion with AI-driven analysis to produce explainable, actionable summaries of exactly the kind of cross-currents this market is throwing at investors right now. Same philosophy as our AI trading agent stack: explainable AI applied to real markets, with the reasoning made visible.
Markets at records during a war, with the most divided Fed since 1992 and a major airline collapsing on the same weekend, is exactly the moment you want a research process that does not get distracted by either headline. That is what we are built for. Discover how AssetWhisper transforms your investment process and get institutional-grade analysis applied to your portfolio every week.
Because earnings are growing faster than the war is shrinking them, and because the market has decided the conflict will not produce a global recession. After Big Tech reported, Q1 2026 S&P 500 earnings growth jumped to 27.8% — the strongest pace since Q4 2021 — far above the mid-teens consensus from a month earlier. Records and wars have coexisted before — most recently during the Ukraine conflict — and the deciding factor each time has been the trajectory of corporate profits, not the headlines.
It depends on your time horizon and what's already in your portfolio. For long-term, diversified investors, dollar-cost averaging into broad indexes has historically worked even when initiated at record highs. For tactical traders, records are a reason to tighten risk management, not to add aggressively. The framework in How to Invest in the Financial Market the Right Way applies cleanly here.
The base case is still one quarter-point cut by year-end, but the probability of zero cuts has risen meaningfully after April's 8-4 dissent vote — the most divided FOMC since October 1992. With three regional presidents publicly opposed to easing-bias language and a chairmanship transition underway, the bar for a cut is now higher than it appeared in March.
Gold has worked extraordinarily well for nearly two years and has structural demand from central banks that does not depend on the next 5% move. That said, it is more volatile than it used to be — a 14% drawdown in three days is on the recent record. For most diversified portfolios, gold deserves a 5%–10% allocation as a real diversifier, not a single-position bet.
Energy (driven by oil prices and a ~40% upward revision to 2026 sector earnings), technology (AI capex and earnings — Communication Services, Information Technology, Consumer Discretionary, and Materials are all posting double-digit Q1 growth), and industrials with AI-data-center exposure (Caterpillar's print is the cleanest signal). Consumer discretionary and staples have been pressured by higher gasoline prices.
You should not panic-sell, but you should size positions accordingly. A near-zero equity risk premium means you are not being paid to take equity risk over Treasuries. That historically increases the cost of being wrong. Diversification, quality tilts, and explicit rebalancing rules become more valuable in this regime, not less.
Indirectly but significantly. Higher oil flows through to gasoline (the U.S. national average is now $4.39, up roughly 50% from late February), transport costs, consumer discretionary spending, and inflation expectations — which in turn shape Fed policy and bond yields. Even an "AI tech" portfolio is sensitive to the conflict through Fed-sensitivity and consumer demand for the products those companies sell.
For the index, very little — Spirit was a small-cap with declining market share. For investors, it is a reminder that idiosyncratic risk does not respect macro narratives. A company can be in trouble for years and then collapse over a weekend when one specific catalyst (a failed bailout in Spirit's case) lines up with one specific shock (jet fuel prices). The takeaway is not "avoid airlines"; it is to keep position sizes consistent with the risk that any single thesis can fail abruptly.
May 2026 is a market that will reward investors who hold two contradictory ideas at once. Yes, U.S. equities are at all-time highs, Q1 earnings just printed at 27.8% growth, and the AI capex cycle is broadening into industrials and energy. And yes, oil is at $102, gold is at $4,600, gasoline is up 50%, the Fed just delivered its most divided vote in 34 years, and a major U.S. airline ceased operations between Friday's close and Saturday's open. Both pictures are accurate. The right portfolio reflects both.
The investors who will compound through the rest of 2026 are not the ones who pick the right narrative. They are the ones who build positioning that survives if the narrative shifts — discipline at all-time highs, diversification across geopolitical scenarios, real hedges, and a written plan they can actually follow. That is the playbook we have been refining at AssetWhisper, and it is the one that will matter most in the next 30 to 60 days, particularly as the Powell-to-Warsh Fed transition unfolds.
Records, war, a historically divided Fed, and a weekend airline collapse make for an unusually loud tape. The signal in it is the same as in every cycle: own quality, manage risk, and let earnings — not headlines — do the work.
Markets move daily. Your edge comes from synthesis. Discover how AssetWhisper turns real-time market data into explainable, actionable analysis — and get the next update before it hits the headlines.