Nvidia’s Jensen Huang Scandal: Key-Person Risk, the Board’s Probe and What Investors Can Check
Jensen Huang, the alleged spy link and Nvidia's board probe: what is reported, what the stock did against chip peers and what investors can check.
Independent market analysis
Long-form research on portfolio construction, risk, macro and the tools that actually move returns. No hype, no tips, no paywall.
Jensen Huang, the alleged spy link and Nvidia's board probe: what is reported, what the stock did against chip peers and what investors can check.
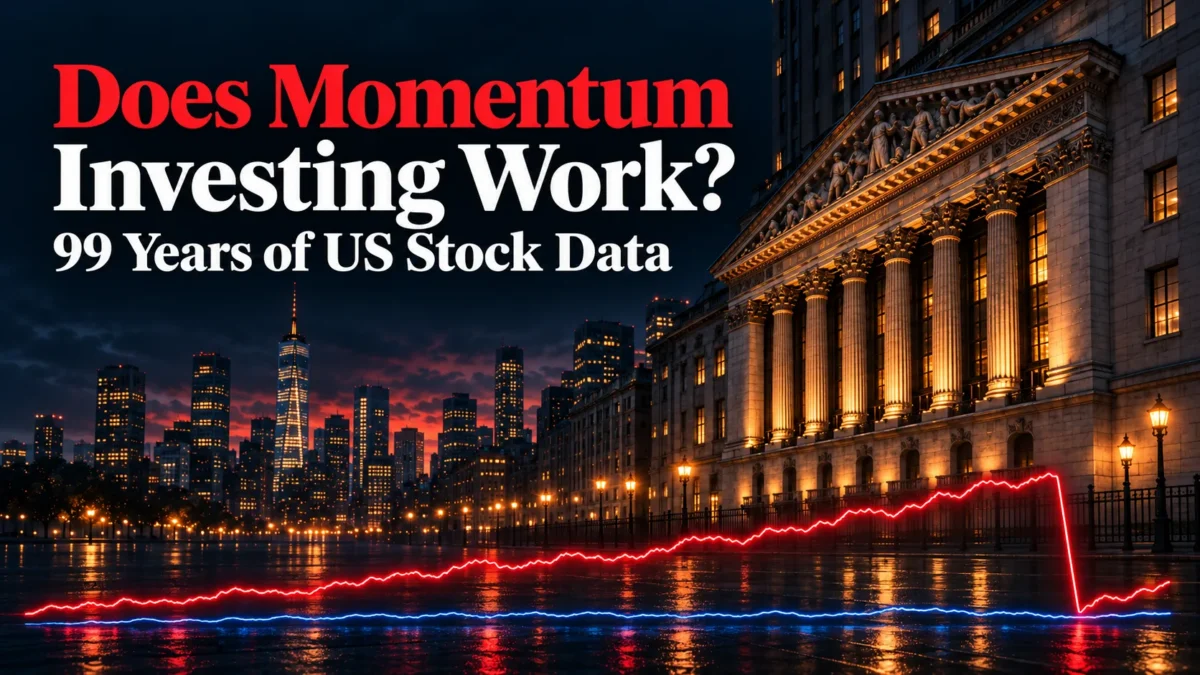
From 1927 to September 2026, the tenth of US stocks with the best past year returned 16.9% a year before costs, against 10.3% for the market. Winners minus losers earned 7.4% a year, but lost 74% in July–August 1932, 58% in 2008–09, and has not regained its November 2008 peak.
From 1969 to 2026 the average US industry had 23.2% annual volatility. Ten industries chosen at random cut it to 17.8% and all 48 to 17.2%, but diversification did not protect against the market’s own fall: weighted by value, the 48 industries lost within 1.3 points of the market in six falls of more than 20%.
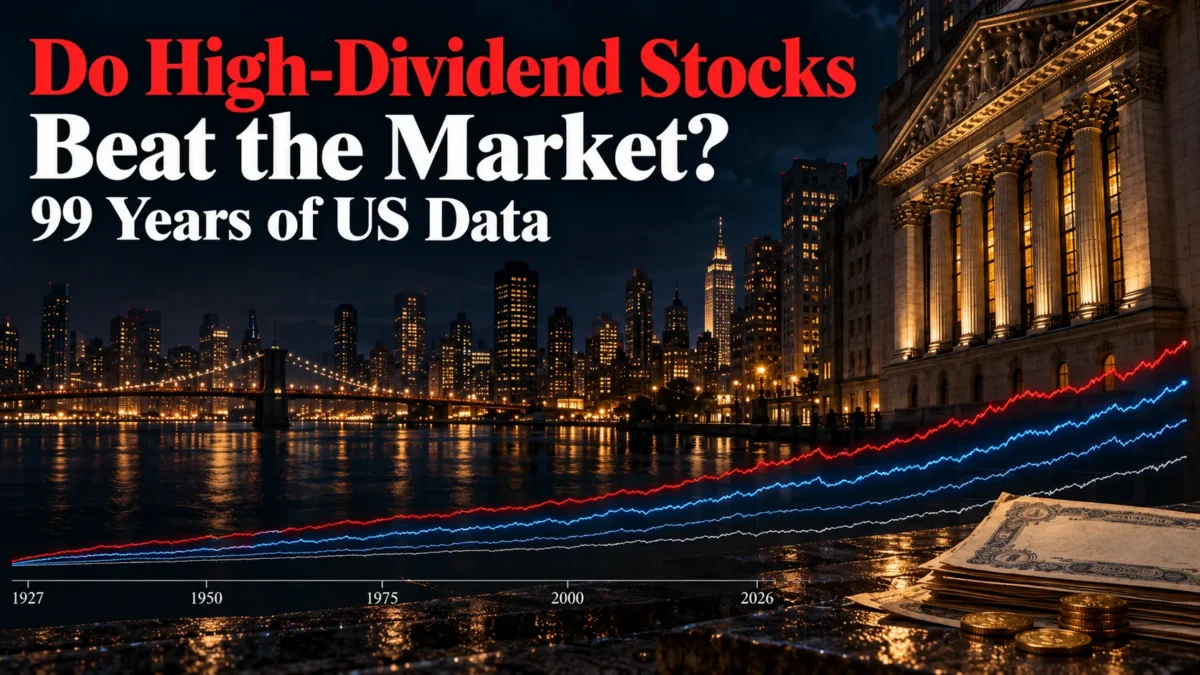
From July 1927 to September 2026 the highest-yielding 30% of US stocks compounded at 11.34% a year against 10.26% for the market. Most of that edge is the value premium: after size and value, 0.21 points a year are left. The top 10% by yield did worse than the next two groups, with more risk.
Lula won Brazil’s runoff with 51.79%. By Monday morning Ibovespa futures fell as much as 19.85%, the dollar fixing rose 11% and B3 halted share trading.
US stocks split as Brent settled at $116.72 and AI financing costs came into focus, while PHP2Shell, a Node.js RCE and the eMudhra certificate compromise exposed another cost of the AI economy.
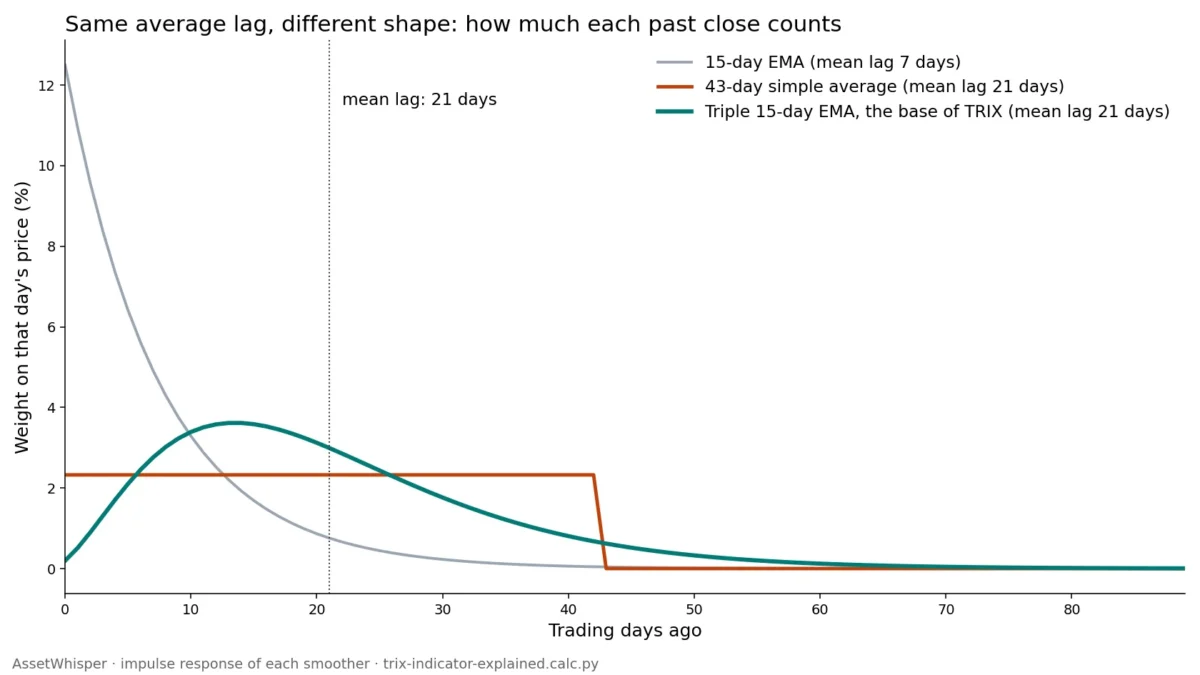
TRIX is the daily change of a price smoothed three times. On the S&P 500 since 1954, the 15-day TRIX lagged 21 trading days on average and crossed zero a third as often as a same-lag average, but no TRIX rule beat buy-and-hold on return, nor a same-exposure mix after 1992.
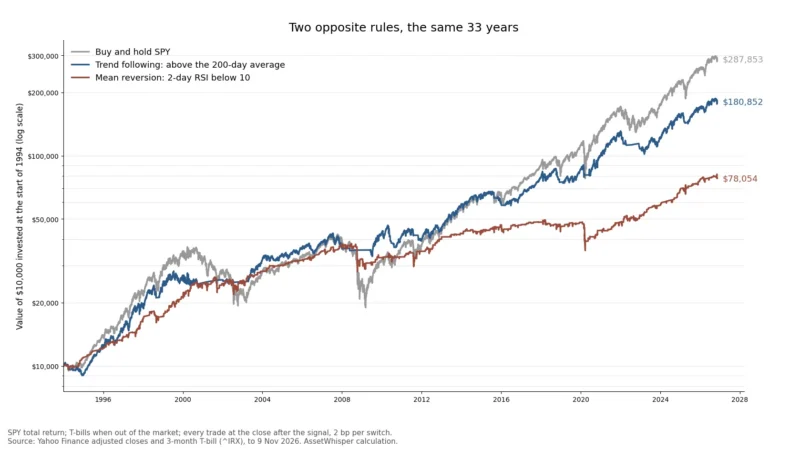
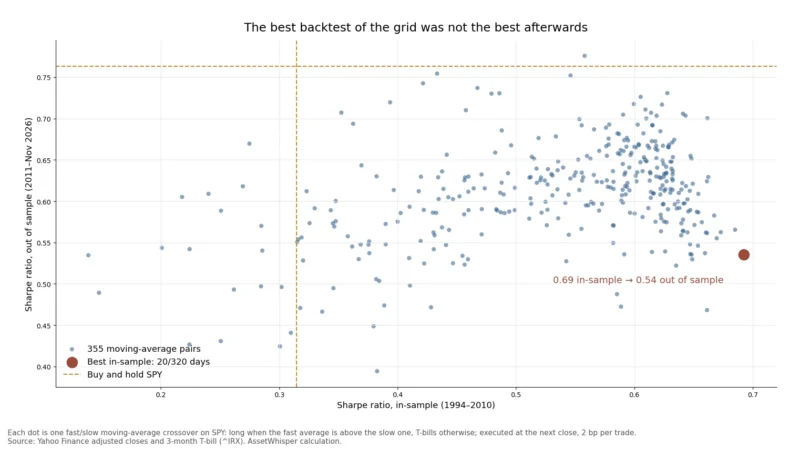
On the S&P 500 from 1954 to 2026, with costs and next-day execution, none of four common indicator rules or 90 variants of them beat buy-and-hold on return after 1992. MACD and TRIX lost to a same-exposure stock-and-bill mix in both periods; the 200-day average kept a better Sharpe ratio, not a return edge.
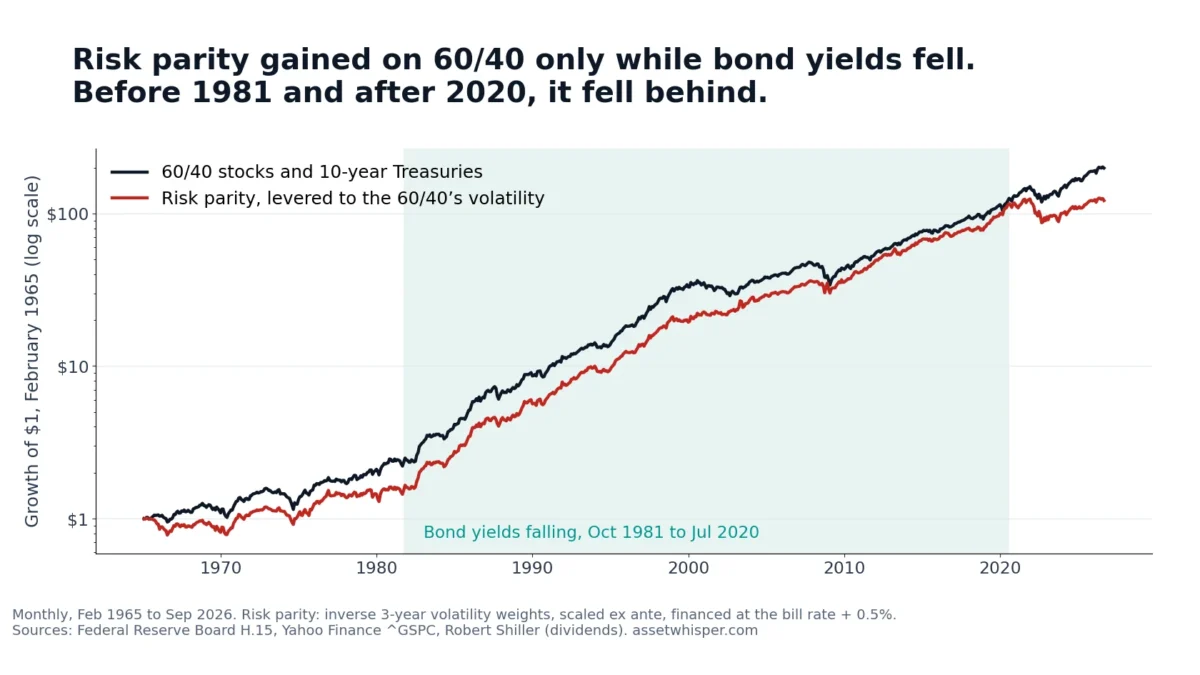
In the papers that made them famous, risk parity beat 60/40 and volatility timing raised the market's Sharpe ratio by a quarter. From 1965 to 2026, risk parity trailed 60/40 (Sharpe 0.35 against 0.45) and lost 28% in 2022. Volatility targeting cut the 2007–09 loss from 50% to 30%, but its Sharpe gain did not last.
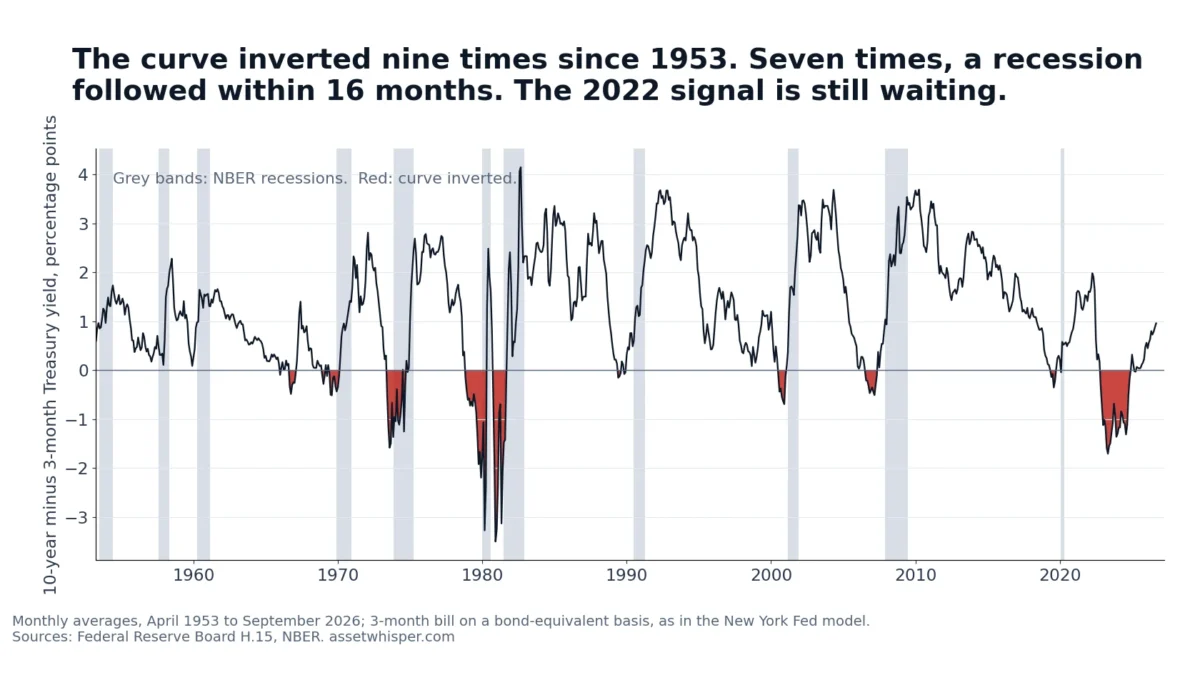
Since 1953 the 10-year minus 3-month Treasury spread has inverted nine times. Seven inversions were followed by a recession 5 to 16 months later. Two were not: 1966, and the record 2022–2024 inversion, which has not been followed by a recession the NBER has dated. The signal says little about timing, and less about stocks.