The Impact of Interest Rates on Investment Choices
Key takeaway
Interest rates move every asset, but not as one number: the Fed sets the short rate, the market sets the rest, and real yields do most of the damage to valuations. The 2026 hike and a 5% 10-year show why the distinction matters.
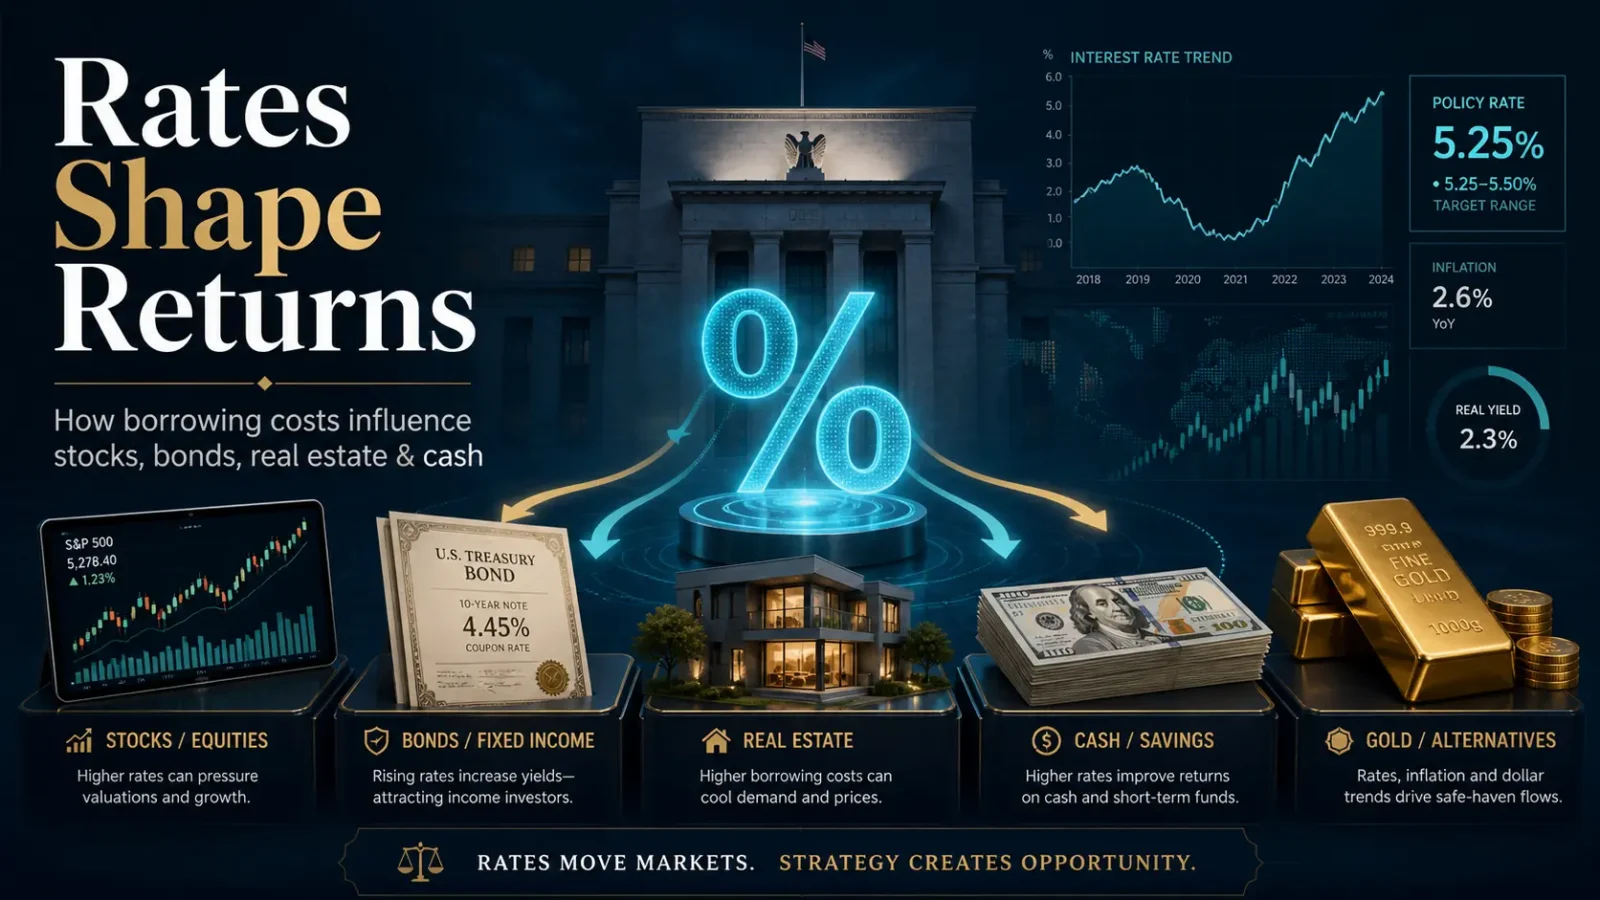
If there is one variable that quietly governs the price of every asset on your screen, it is the interest rate. Bonds, stocks, real estate, commodities, gold, even crypto — none of them is valued in a vacuum. They are valued relative to what cash and government bonds pay. The distinction most explanations skip is that there is no single “interest rate”. The central bank sets one short rate by vote; the market sets every longer rate by trading, and the part of a long yield that does most of the damage to valuations is the real yield — what money earns after expected inflation — not the headline number.
September 2026 shows the difference. On 16 September the Federal Reserve raised its target range by a quarter point, to 3.75%–4.00%, its first increase since July 2023. By 24 September the 10-year Treasury yield had closed at 5.18%, the highest close in the Treasury’s daily series since July 2007. Yet the inflation rate the bond market prices over the next decade was lower than in May: the 10-year breakeven went from 2.48% on 1 May to 2.33%, while the 10-year real yield rose from 1.91% to 2.85%. The whole rise in the 10-year, and more, came from the price of money after inflation. We take those numbers apart in the 10-year Treasury at 5%: what it is and is not pricing.
This guide is about the machinery rather than the month: what interest rates are, how the Fed sets the short end, how each asset class responds, and how to turn that into portfolio criteria that survive the next cycle. It is the foundation for the rate-sensitive frameworks in Crisis-Proof Investments and Portfolio Hedging Strategies: What Each One Costs.
| Asset | Main channel to rates | When yields rise | Where the rule breaks down |
|---|---|---|---|
| Short Treasuries, cash | Yield resets quickly to the policy rate | Income rises; price barely moves | Income falls just as fast when the Fed cuts |
| Long Treasuries | Duration: fixed coupons repriced | Price falls roughly by duration × change in yield | Long yields can rise while the Fed cuts, and fall while it hikes |
| Growth equities | Discount rate on distant cash flows | Valuations compress most | Strong earnings news can outweigh a higher discount rate |
| Banks, insurers | Net interest margin, investment income | Earnings often benefit | A flat or inverted curve squeezes bank margins |
| Real estate, REITs | Mortgage rates, cap rates, refinancing | Values and transactions come under pressure | Rents that grow with inflation can offset part of it |
| Gold | Opportunity cost versus real yields | Tends to weaken | Gold rose 137% from end-2021 to end-2025 while real yields rose |
| TIPS | Real yield, plus inflation accrual | Price falls if real yields rise | They hedge inflation surprises, not rising real rates |
The practical consequence: “rates went up” is not enough information to know what happened to a portfolio. You need to know which rate, by how much, and whether the move came from real yields or from inflation expectations.
What Interest Rates Actually Are
An interest rate is two things at once: the price you pay to borrow money, and the price you receive for lending it. Every other definition flows from those two ideas.
In the United States, the most important short-term rate is the federal funds rate — the rate banks charge each other for overnight loans of reserves. The Federal Reserve sets a target range for this rate (3.75%–4.00% since 16 September 2026) and uses its policy tools to keep it there. Credit cards, adjustable-rate loans, money market yields and short-term corporate borrowing are all anchored, directly or indirectly, to it.
Long-term rates, in contrast, are set by the market. The 10-year Treasury yield reflects investors’ collective expectations about the future path of short-term rates, plus a “term premium” for the risk of locking up money for a decade. Mortgages and most corporate bonds price off this long end, not off the fed funds rate. On 1 May 2026 the 2-year yield was 3.88% and the 10-year 4.39%, a gap of 0.51 percentage points. By 24 September they were 4.87% and 5.18%: both higher, but the gap had narrowed to 0.31 points, because the market was pricing a Fed that would hike rather than cut.
Understanding this distinction matters because short rates and long rates do not always move together. A central bank can cut even as long-term yields rise, if the market believes the cuts will reignite inflation or that government borrowing will keep growing. That is what happened in late 2024: the Fed cut by a full percentage point between September and December, and the 10-year yield rose from 3.70% on the day of the first cut to 4.58% at year-end. We explain the mechanism in why bond yields rise when central banks cut rates.
The Fed in 2026: From a Divided Hold to a Hike
The Fed held its target range at 3.50%–3.75% at every meeting from January to July 2026. The April 29 meeting, the last before Jerome Powell’s term as chair expired in May, was the first to signal trouble. The committee voted 8–4 to hold, and the four dissents broke in opposite directions:
- Governor Stephen Miran dissented in favour of a 25-basis-point cut.
- Cleveland Fed President Beth Hammack, Minneapolis Fed President Neel Kashkari and Dallas Fed President Lorie Logan supported the hold but opposed the statement’s easing bias — the language implying that the next move would be a cut.
In June the committee held again, 12–0. In July it held by 9–3, and this time the same three presidents — Hammack, Kashkari and Logan — dissented in favour of a quarter-point increase. The argument inside the Fed had moved from whether to keep signalling cuts to whether to hike.
At the September 15–16 meeting, chaired by Kevin Warsh, the committee raised the range to 3.75%–4.00% by a 12–0 vote. The statement said “Inflation remains elevated” and that the move “will support a timelier return to the Committee’s 2 percent goal.” It gave no guidance about the next move. The median projection for the federal funds rate at the end of 2026 rose to 4.1%, from 3.8% in June — a level that corresponds to one more quarter-point increase before the year is out. The next meetings are on 27–28 October and 8–9 December.
Headline inflation is running well above core. In the Bureau of Labor Statistics’ August CPI, prices were up 3.4% over twelve months; excluding food and energy, they were up 2.4%. The point of the hike is to stop that gap from closing upward.
Three lessons outlast the specific dates:
A consensus rate path is a forecast, not a fact. In April the statement still carried an easing bias. By September the Fed had hiked. Portfolios built on the assumption that “cuts are coming” were exposed to exactly the move that happened.
Dissents are information. The three presidents who objected to the easing bias in April were voting for a hike by July, two months before the committee followed. A split vote tells you the distribution of outcomes is wider than the statement suggests.
A chair has one vote. The chair transition was treated as a market variable in the spring. The September decision was unanimous, which says more about the data the committee was looking at than about any one person’s preferences.
How Interest Rates Affect Each Major Asset Class
Every asset class has its own sensitivity to rates. Get the mechanics right and the rest of portfolio construction becomes much easier.
Bonds: The Most Direct Relationship
Bonds and interest rates have an inverse mechanical relationship. When new bonds are issued at higher yields, the market price of older, lower-yielding bonds falls so that their yield to maturity matches what is available now. When new yields fall, older bonds become more valuable.
The magnitude of the move is captured by duration — a measure of how much a bond’s price changes for a given change in rates. As a rule of thumb, a bond with a duration of 7 years loses roughly 7% of its value if yields rise by 1 percentage point, and gains roughly 7% if they fall by the same amount. A 10-year Treasury bought at par on 1 May 2026 had a modified duration of about 8; the 0.79-point rise in its yield to 24 September implies a price loss of roughly 6%, before counting the coupon.
That produces clear criteria for each segment of the curve:
- Short maturities (2 years and under) carry little rate sensitivity, and their yields reset quickly when the Fed moves. On 24 September 2026 the 3-month bill yielded 4.24% and the 2-year note 4.87%. They suit money with a short horizon. The risk is reinvestment: when the Fed eventually cuts, that income falls with it.
- Intermediate maturities (5–10 years) carry meaningful rate risk. They lose value if yields keep rising and gain if they fall.
- Long maturities (20–30 years) carry the most duration, in both directions. The 30-year yield was 5.47% on 24 September. Whether that is compensation enough depends on your horizon and on how much a double-digit mark-to-market loss would change your behaviour.
Within bonds, credit quality matters too. Investment-grade corporates yield more than Treasuries because they carry default risk; high-yield (“junk”) bonds yield more still because the default risk is higher. In a slowing economy credit spreads widen — lower-quality bonds underperform — which is a separate risk from pure rate movements.
Stocks: A More Complex Picture
Stocks respond to rates through three channels, and each cuts differently across sectors.
Channel one — discount rates. Stocks are valued by discounting future cash flows back to the present. When rates rise, and especially when real rates rise, the present value of those future cash flows falls. This hits growth stocks — companies whose earnings are expected years from now — much harder than value stocks, whose earnings are largely happening today.
Channel two — borrowing costs. Companies that rely on debt to fund expansion face higher interest expense when rates rise, which compresses margins and slows growth. Highly leveraged businesses feel this most. Companies with net cash and little debt barely feel it, and some earn more on their cash.
Channel three — sector economics. Some sectors benefit from higher rates. Banks can earn more on their net interest margin, particularly when the curve is steep. Insurers invest premiums in fixed income, so higher yields mean higher investment income.
The link that matters most for the index as a whole is the gap between the stock market’s earnings yield (earnings divided by price) and the yield on government bonds — the equity risk premium. Measured against the 10-year TIPS yield on CAPE earnings, it turned negative in September 2026 for the first time since at least 2003. When that gap is thin, investors are being paid little extra for equity volatility, and downside surprises become more expensive. It is not a timing signal: stocks can rally with a thin premium for a long time, as they did in September 2026 when the real 10-year yield was rising (see why stocks rallied anyway). It does mean that more of the return has to come from earnings actually arriving.
Rate sensitivity belongs in fundamental analysis alongside valuation and balance-sheet strength; we discuss how the two approaches differ in Technical Analysis vs. Fundamental Analysis.
Real Estate and REITs: Among the Most Rate-Sensitive Assets
Real estate is rate-sensitive on both ends. Higher mortgage rates reduce affordability and slow housing transactions, putting pressure on prices. Higher cap rates (the inverse of valuation multiples) reduce commercial property values directly. And REITs, which finance a large share of their assets with debt, face higher refinancing costs when rates rise.
The mechanics work in reverse too. When rates fall, mortgage payments shrink, transaction volumes pick up, cap rates compress, and property values rise. This is why real estate has historically been one of the main beneficiaries of cutting cycles.
The case for REITs therefore depends on the rate path, and 2026 is a reminder that the path can turn. Three scenarios cover most of the range: a cutting cycle helps them; rates stuck near current levels leave them dependent on rent growth; renewed inflation and further hikes hurt them. Mortgage rates follow the long end of the Treasury curve, so a hiking Fed and a 10-year above 5% are the unfavourable case. We go deeper into this asset class in our guide on Real Estate Investment Trusts (REITs).
Commodities: An Indirect but Powerful Channel
Commodities respond to rates through three indirect channels:
Currency effects. Higher U.S. rates tend to strengthen the dollar, which makes dollar-priced commodities more expensive for foreign buyers and dampens demand. The effect is a tendency, and other forces — trade, geopolitics, reserve preferences — can overwhelm it for long periods.
Inflation expectations. Commodities are real assets, and they tend to do well when inflation expectations rise. A central bank that falls behind inflation is supportive for commodities; one that hikes hard enough to crush inflation expectations is not. Causation also runs the other way: in 2026 an oil shock drove inflation, and inflation drove the Fed.
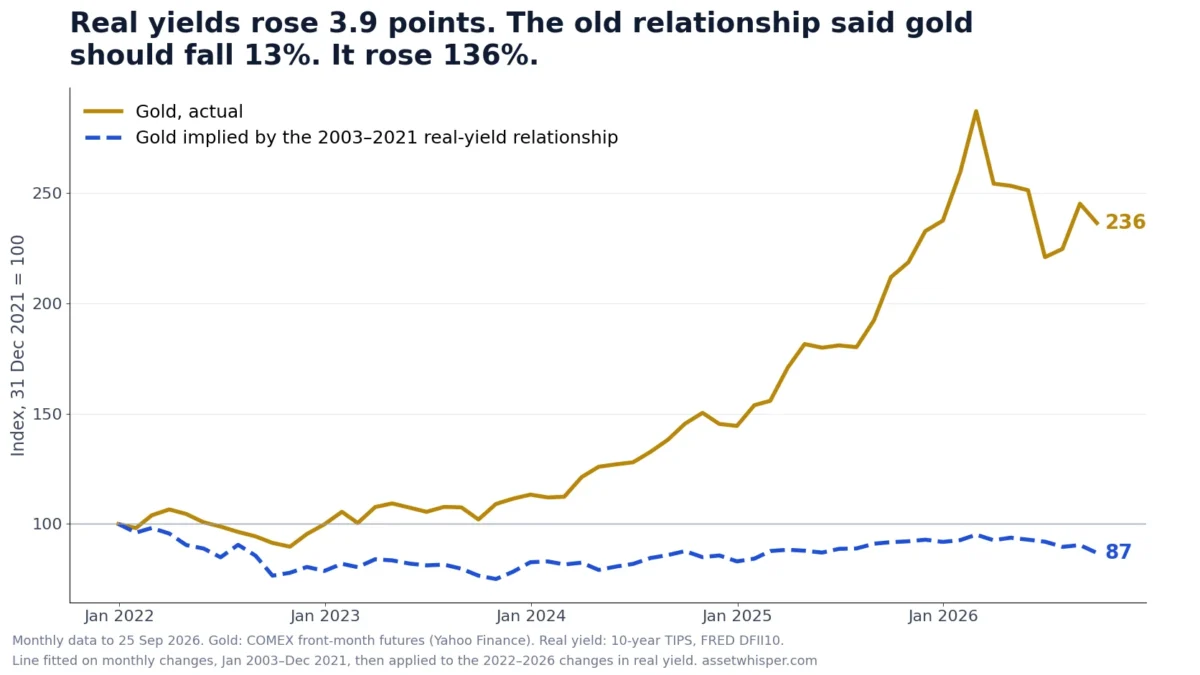
Opportunity cost. Gold and other non-yielding commodities compete with bonds for capital. The textbook rule is that high real yields weaken gold’s appeal and falling real yields strengthen it. The recent record shows how loose that rule can be. The 10-year real yield went from −1.04% at the end of 2021 to 1.93% at the end of 2025, a rise of nearly three points, and front-month gold futures still rose from $1,828.60 to $4,341.10, a gain of 137%. In 2025 alone they rose 64.4%, first closing above $4,000 on 7 October. Something other than the real rate was driving the price, which is why gold belongs in a portfolio as a diversifier with its own drivers, not as a rate trade. See Portfolio Hedging Strategies for what gold has and has not done as a hedge.
Cryptocurrency and Stablecoins: An Increasingly Rate-Sensitive Asset Class
Crypto used to trade on its own narrative cycle, largely disconnected from rates. That changed as institutional adoption deepened and the asset class developed yield-bearing instruments.
The rate connection now runs through three channels:
- Risk-asset correlation. Bitcoin and Ethereum have tended to move with the Nasdaq and other risk assets, and to fall when rates rise sharply.
- Stablecoin yields. The GENIUS Act bars regulated stablecoin issuers from paying interest to holders, but third-party yield-bearing products built on top of stablecoin reserves pass through part of the Treasury bill yield. Their returns rise and fall with short-term rates — and they carry risks a bill does not. We unpack the rules in our deep dive on the GENIUS Act and Stablecoin Regulation.
- DeFi lending rates. On-chain borrowing and lending markets respond to traditional rates because capital arbitrages between the two systems.
For investors with crypto exposure, the rate environment is a first-order portfolio variable, not a footnote.
How Interest Rates Reshape Portfolio Construction
The traditional 60/40 portfolio (60% stocks, 40% bonds) was built on the assumption that stocks and bonds move in opposite directions during stress. That assumption broke down in 2022, when both fell sharply, and it remains fragile in any environment where inflation surprises drive the central bank’s policy.
Three portfolio-construction implications follow.
The 60/40 Is No Longer Self-Diversifying
When inflation is the dominant macro variable, stocks and bonds can move together — both fall when rates rise faster than expected; both rise when rates fall faster than expected. The “natural hedge” of bonds within a 60/40 portfolio works much better in growth-driven cycles than in inflation-driven ones.
The response is not necessarily to abandon 60/40 but to test whether each holding has a genuinely different driver. Gold, broad commodities and short-duration bonds have drivers that differ from those of stocks and long bonds; each also has long stretches of doing nothing useful. How much, if any, belongs in a portfolio depends on the investor, not on the month. We examine the evidence in Is 60/40 Still Alive?
Duration Risk Cuts Both Ways
The 10-year’s 5.18% close on 24 September 2026 was the highest since July 2007. A higher starting yield is a cushion: at that yield, a 10-year note with a duration of about 7.7 can absorb a rise of roughly 0.67 percentage points over a year before its price loss wipes out a year’s coupon. At a 2% yield the cushion is a fraction of that.
A cushion is not a floor. A yield that looks high can go higher: the 10-year’s 4.98% close on 19 October 2023 looked like a cycle peak, and in September 2026 it was exceeded. If inflation expectations or the term premium climb further, long bonds keep losing; if growth weakens and the Fed reverses, they rally.
The practical consequence: decide on duration deliberately. A mix of short maturities, for income with little price risk, and intermediate maturities, for some upside if yields fall, limits exposure to the part of the curve where a wrong call costs most. Long bonds are a position sized for the loss you can tolerate, not a default.
Quality and Cash Flow Beat Multiple Expansion
When equity valuations are high relative to bond yields, further gains have to come mainly from earnings rather than from investors paying more for each dollar of earnings. That shifts the weight toward companies with strong balance sheets, durable cash flow and pricing power. They can grow earnings even if multiples compress, which is the cushion you want when rates may stay higher for longer. The framework for finding them sits at the intersection of fundamentals and valuation discipline — see How to Identify Undervalued Assets for the full method.
Strategic Playbooks by Investor Type
The right response to a rate environment depends on who you are. None of what follows is a recommendation to buy a specific security; these are the questions each type of investor should be able to answer.
Conservative Income Investors
Higher yields raise the income available from safe assets, which is the good news. The criteria that matter: spread maturities rather than concentrating in one point of the curve; know the duration of every bond fund you hold; compare any yield against what Treasury bills of the same horizon pay before accepting extra credit risk; and treat a dividend yield as a claim on a company’s cash flow, not as a bond coupon. The Advantages of Dividend Investing covers what dividends can and cannot do in an income strategy.
Growth-Oriented Investors
Higher real rates raise the bar that growth stocks must clear. The test to apply to any growth holding: is its growth self-funded, or does it depend on cheap capital to keep going? Unprofitable companies whose value lies mostly in distant cash flows carry the highest rate sensitivity and belong, if at all, in positions sized for that. Thematic funds concentrated in long-duration growth, such as those covered in our AI ETFs guide, carry the same exposure at portfolio level.
Tactical Traders
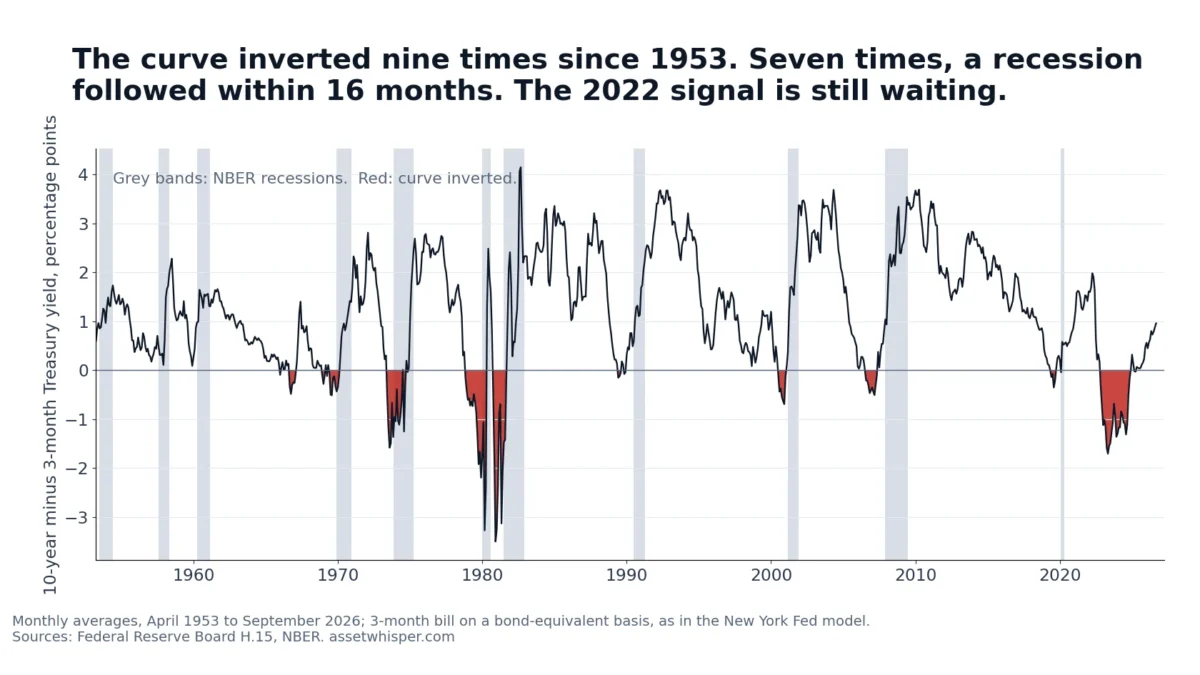
A committee that has just changed direction produces volatile rate markets, and every data release can move yields. The spread between two-year and ten-year Treasuries (the “2s10s curve”) is worth watching, but read it with the direction of both legs: a curve that steepens because short yields fall is usually pricing cuts; one that steepens because long yields rise is pricing inflation or term premium. As a recession signal, the curve has a better but imperfect record: we went through every inversion since 1953 in yield curve inversions and recessions. When comparing strategies across rate regimes, the Sharpe ratio is more useful than headline returns.
Long-Term Buy-and-Hold Investors
You probably should not change much. Your edge is time, not timing. The discipline that matters is rebalancing to your target weights, which mechanically adds to whatever the rate cycle has hit hardest without requiring a forecast. The Successful Investor Mindset framework remains the most important variable.
New Investors Building a First Portfolio
Start with the criteria rather than the rate call: low costs, broad diversification, and bond holdings whose duration matches when you will need the money. Resist the urge to optimise for current rates — the goal is a portfolio that works across several rate regimes, not one tuned for a single month. Whether to invest at once or in stages is a separate decision from the rate call. Robo-advisors can handle diversification and rebalancing at this stage; we cover them in The Rise of Robo-Advisors.
Tools for Managing Interest Rate Risk
Beyond asset allocation, several specific tools help control rate risk in a portfolio.
TIPS (Treasury Inflation-Protected Securities). TIPS are Treasury bonds whose principal adjusts with inflation. They protect purchasing power when inflation surprises higher. They do not protect against rising real yields: when real yields rise, TIPS prices fall like any other bond. The 10-year TIPS real yield went from 1.91% on 1 May 2026 to 2.85% on 24 September, so a TIPS buyer in May took a price loss even as inflation ran above target. A buyer at 2.85% who holds to maturity locks in that real return before tax.
Floating-rate bonds and bank loans. These pay yields that reset periodically based on a reference rate, so their prices move little when rates change. They remove duration risk, not credit risk: bank loans are typically made to leveraged borrowers.
Interest rate derivatives. Sophisticated investors use futures, options and interest rate swaps to hedge specific rate exposures. These instruments require expertise — small mistakes get expensive — but they offer surgical control over rate risk that ordinary cash bonds cannot.
Cash and money market funds. Money market yields follow the policy rate closely, so with the fed funds range at 3.75%–4.00% cash is no longer the drag it was in the zero-rate era. How much to hold depends on your spending horizon and on how you would react to a drawdown, not on the current yield; and a real return on cash still requires a yield above inflation, which is the trap covered in Why Savings Lose Value.
The broader framework for combining these tools is in our piece on How to Manage Risk in Your Financial Investments, and the specific hedging mechanics are detailed in Portfolio Hedging Strategies: What Each One Costs.
What to Watch in the Rate Cycle
Four signals tell you when the rate environment is shifting. None of them is a forecast; each tells you which way the risks are leaning.
The Fed’s projections against the market’s pricing. After the September 2026 meeting, the median projection pointed to one more quarter-point increase before year-end. The next meetings are on 27–28 October and 8–9 December. What matters for asset prices is not the projection itself but the gap between it and what futures markets price: surprises move yields, confirmations rarely do.
Inflation prints, headline and core. In August 2026 headline CPI was up 3.4% over twelve months and core CPI 2.4%, a gap that reflects energy. If energy prices spread into core, the case for further hikes strengthens; if the energy shock fades and core stays near 2.4%, the September hike could prove to be the last. The Fed’s preferred gauge is PCE inflation, published by the Bureau of Economic Analysis.
Real yields versus breakevens. Split the 10-year yield into its real yield (observable on TIPS) and breakeven inflation (the difference). A rise driven by real yields means tighter money and a higher hurdle for every asset; a rise driven by breakevens means the market doubts the Fed on inflation. Between 1 May and 24 September 2026 it was the first. We walk through the split in the 10-year Treasury at 5%.
Yield curve dynamics. The shape of the Treasury curve aggregates the views of every bond investor. Read the 2s10s spread together with the direction of each leg: between 1 May and 24 September 2026 the 2-year rose 0.99 points and the 10-year 0.79, so the curve flattened as hikes were priced in. Why the long end can move against the policy rate is the subject of why bond yields rise when central banks cut rates.
Common Mistakes Investors Make in Rate Cycles
Four patterns repeat in every rate cycle, and they are all expensive.
Positioning for the consensus rate path. In spring 2026 the question was when the Fed would cut. In September it hiked. Portfolios that only worked if cuts arrived were a forecast dressed as an allocation.
Chasing yield without understanding credit risk. When rates are high, investors hunt for “extra yield” by buying lower-quality bonds, emerging market debt, or complex products they don’t fully understand. This works until it doesn’t, and the unwind is fast. We covered this category of error in Common Mistakes in Stock Market Investing — the rate version is the same trap dressed differently.
Trying to time the peak in long-bond yields. Every rate cycle produces a wave of investors trying to call the top in yields and pile into long-duration Treasuries. Sometimes it works. Often the peak takes longer than expected, the entry is premature, and the duration drawdown is painful. Deciding on duration in advance, as described above, is designed to avoid this trap.
Letting fear drive panic-selling during volatility. Rate-driven volatility produces sharp drawdowns in bonds and stocks alike. Investors who react emotionally — selling at lows, buying back too late — damage their long-term returns. The discipline in Behavioral Finance: Six Biases, and What Each One Actually Costs is the antidote.
Conclusion
Interest rates are the gravity of finance. They pull on every asset, shape every valuation, and set the trade-off between safety and growth at the heart of every portfolio decision. 2026 has been a reminder of how quickly the direction can change: from a statement with an easing bias in April, to three dissents for a hike in July, to a unanimous hike in September.
The framework that works across rate cycles is durable: understand which assets are most rate-sensitive and why; separate real yields from inflation expectations; diversify across drivers, not just across labels; manage duration deliberately rather than by accident; and let the Fed’s communications inform your portfolio without dictating it. Combine that with a clear written plan and you will handle the next cycle — whatever it brings — better than investors who treat rates as background noise.
Frequently asked questions
What is the current Federal Reserve interest rate?
As of 25 September 2026, the federal funds target range is 3.75%–4.00%. The FOMC raised it by a quarter point on 16 September 2026, by a 12–0 vote, after holding at 3.50%–3.75% at every meeting from January to July. It was the first increase since July 2023. The next meeting is on 27–28 October 2026.
What investments do well when interest rates rise?
Generally: short-maturity bonds and cash, whose income resets upward; floating-rate instruments; banks and insurers, whose earnings can benefit; and value stocks with strong cash flow today. Sectors with high debt loads or growth that depends on cheap capital tend to underperform. TIPS protect against inflation surprises but lose value when real yields rise.
What investments do well when interest rates fall?
Generally: long-duration Treasuries (price appreciation), growth stocks (lower discount rate), and real estate and REITs (lower borrowing costs and cap rates). Gold has tended to benefit from falling real yields, though from 2021 to 2025 it rose even as real yields climbed. Cash and short bonds lose income.
Should I buy bonds when interest rates are high?
A higher starting yield gives more income and more cushion against further rises, but it is not a floor. The deciding criteria are duration and horizon: short maturities carry little price risk but their income falls if the Fed cuts; long maturities gain most if yields fall and lose most if they keep rising. Match the duration to when you will need the money, and size long bonds for the loss you can tolerate.
How does a Fed rate hike affect my portfolio?
Through three routes: cash and short bonds pay more; bonds you already hold lose value in proportion to their duration; and equities face a higher discount rate, which weighs most on long-duration growth stocks. Long-term yields may not follow the hike one for one. After the September 2026 hike the 2-year yield had risen more than the 10-year since May, flattening the curve.
Are TIPS a good investment in 2026?
TIPS are relevant when inflation may surprise higher, and on 24 September 2026 the 10-year TIPS offered a real yield of 2.85%, which a buyer holding to maturity locks in before tax. But TIPS prices fall when real yields rise, as they did between May and September 2026. Whether they fit depends on your inflation exposure and horizon, not on the current headline.
How do interest rates affect cryptocurrency?
Crypto has tended to trade like a risk asset and to fall when rates rise sharply. Yield-bearing products built on stablecoins also pass through part of the Treasury bill yield, so their returns move with short-term rates. See our deep dive on the GENIUS Act and Stablecoin Regulation for the rules on who may pay that yield.
Sources
- Board of Governors of the Federal Reserve System, FOMC statement, 16 September 2026 (target range 3.75%–4.00%, 12–0 vote, quotations cited above).
- Board of Governors of the Federal Reserve System, FOMC statements of 29 April 2026 (hold, 8–4, dissents), 17 June 2026 (hold, 12–0) and 29 July 2026 (hold, 9–3, three dissents for a hike).
- Board of Governors of the Federal Reserve System, Summary of Economic Projections, 16 September 2026, Table 1 (median federal funds rate projection for end-2026: 4.1%; June: 3.8%).
- Board of Governors of the Federal Reserve System, FOMC meeting calendars; FOMC statements of 26 July 2023, 18 September 2024 and 18 December 2024.
- U.S. Department of the Treasury, Daily Treasury Par Yield Curve Rates and Daily Treasury Par Real Yield Curve Rates, 2006–2026. Breakeven inflation is our subtraction of the real from the nominal par yield; durations are our calculation for a par bond with semiannual coupons.
- U.S. Bureau of Labor Statistics, Consumer Price Index, CPI-U U.S. city average, not seasonally adjusted, series CUUR0000SA0 and CUUR0000SA0L1E, August 2026 vs August 2025.
- Gold: COMEX front-month gold futures (GC=F) daily closes, 2021–2025. Futures prices, not the LBMA spot benchmark.
Related reading
- The 10-year Treasury at 5% — why the September 2026 rise came from real yields, not inflation.
- Why bond yields rise when central banks cut rates — the policy rate and the long yield are set by different mechanisms.
- Is 60/40 still alive? — what rate cycles did to the classic stock-bond mix.
- Why savings lose value — what holding cash costs while you wait.
- Portfolio hedging strategies — what each hedge costs, including gold and duration.
This article is general information, not personalised investment advice. It does not take into account the financial situation, objectives or risk tolerance of any individual reader, and nothing in it is a recommendation to buy or sell any security. Rates and yields quoted are dated and will have changed by the time you read this; they describe past market conditions and do not predict future ones. Capital is at risk and past performance does not indicate future results.