Equity Risk Premium: Stocks Now Yield Less Than Real Treasuries on CAPE
Key takeaway
On Shiller's CAPE, the S&P 500's earnings yield (2.44%) fell below the 10-year TIPS real yield (2.85%) on 24 September 2026, the first negative gap since at least 2003; on FactSet's forward P/E the gap is still about 2.4 points, roughly half its ten-year norm. Nearly all of the squeeze since 2021 came from higher real yields, not higher valuations.
The 10-year Treasury closed at 5.18% on Thursday, its highest close since July 2007. The S&P 500 closed 1.2% below its record. Most commentary treats those two facts as a contradiction to be explained away. The more useful question is what they leave for a stock buyer: how much more the stock market earns than a government bond that already beats inflation.
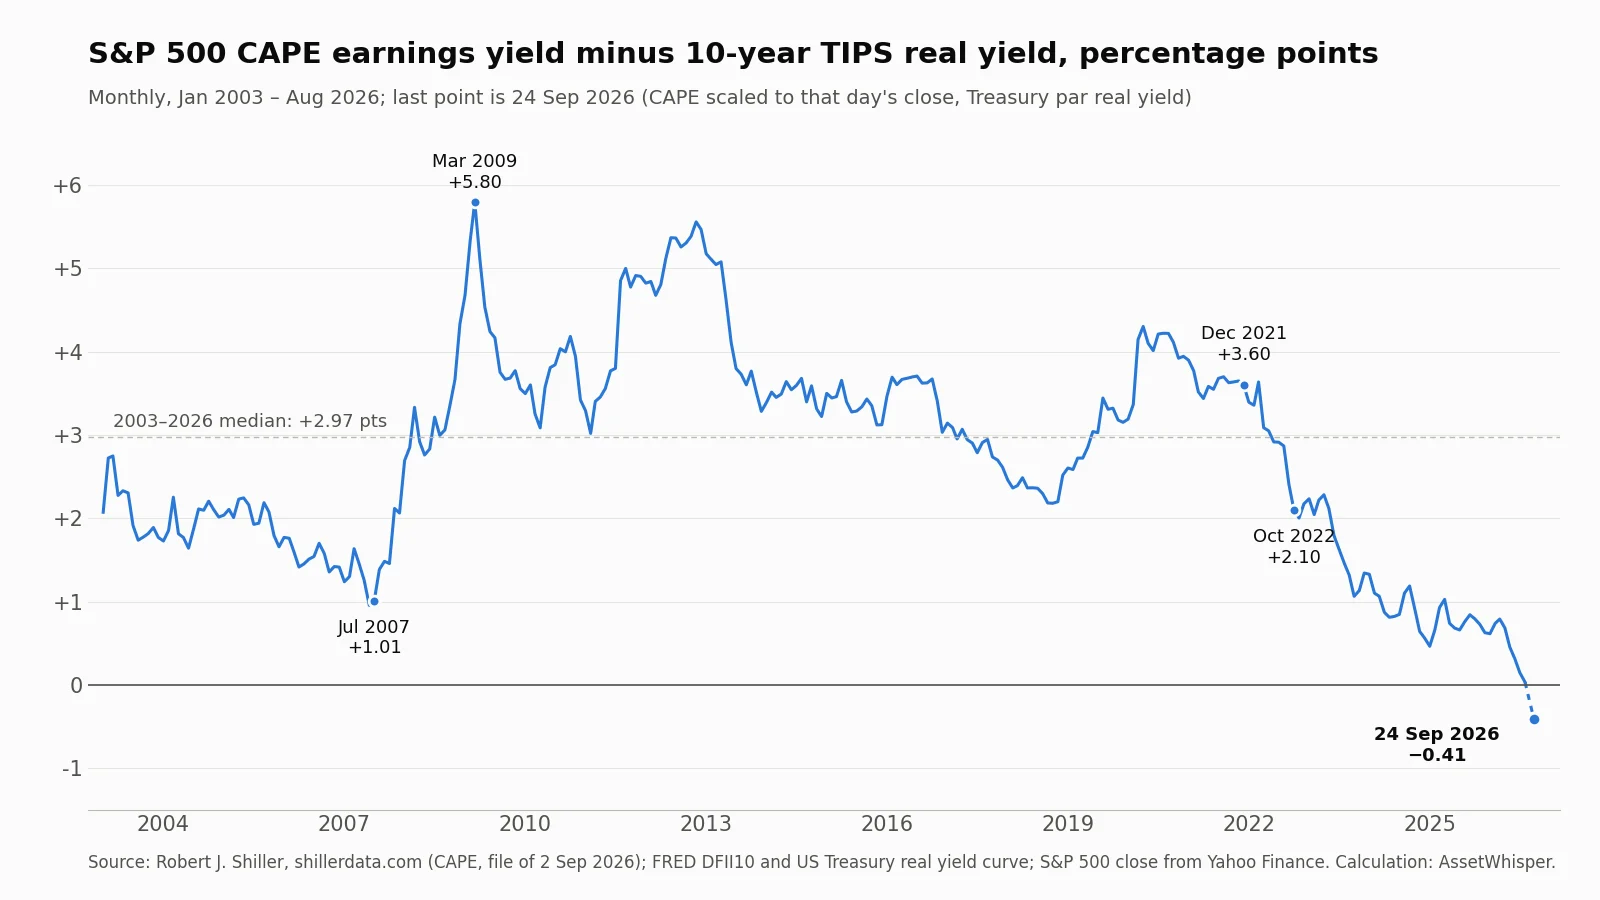
The answer depends on which earnings you count, and that is the distinction most discussions skip. On Robert Shiller’s cyclically adjusted earnings (CAPE), the S&P 500 now yields 2.44%. The 10-year inflation-protected Treasury (TIPS) yields 2.85%. For the first time in the monthly record we rebuilt from January 2003, the market’s smoothed earnings yield is below the real yield on a Treasury: the gap is −0.41 percentage points. On analysts’ forward earnings the gap is still positive, at about 2.4 points, but it is roughly half of what it was in December 2021 or October 2022. Either way, almost none of the squeeze since 2021 came from stocks getting more expensive. It came from the real yield, the same force that took the 10-year to 5% last week, as we showed in the bond market’s real-yield story.
Where things stand after Thursday’s close
| Measure | Close, 24 Sep 2026 | Context |
|---|---|---|
| 10-year Treasury yield | 5.18% | Highest close since 6 July 2007 (5.19%); 5.11% on 23 Sep |
| 5-year Treasury yield | 5.03% | Highest close since 12 July 2007 |
| 20-year Treasury yield | 5.53% | Highest close since 14 June 2004 |
| 30-year Treasury yield | 5.47% | Highest since the bond’s return in February 2006 (not issued 2002–2006) |
| 2-year Treasury yield | 4.87% | Highest close since 10 June 2024 |
| 10-year real yield (TIPS) | 2.85% | Highest close since November 2008 |
| 10-year breakeven inflation | 2.33% | Nominal minus real; unchanged from 22 Sep |
| Federal funds target range | 3.75%–4.00% | Raised a quarter point on 16 Sep, 12–0 |
| S&P 500 | 7,704.13 | 1.2% below the record close of 7,798.99 on 13 Aug |
Yields are the US Treasury’s daily par yield and par real yield curves. The week’s supply cleared at those levels: the 5-year note auctioned on 23 September at a high yield of 5.033% and the 7-year on 24 September at 5.085%.
The premium stocks pay over a real bond, and why the answer depends on the earnings
An earnings yield is earnings divided by price, the inverse of the P/E ratio. Because company earnings tend to rise with inflation over time, it can be read as a rough real return. Subtract the real yield on a 10-year TIPS, which is a guaranteed return above inflation for a buyer who holds to maturity, and what is left is a crude version of the equity risk premium: what the stock market offers for the extra risk. Crude, because it ignores growth and assumes earnings are a fair guide to what shareholders eventually get. Its value is that it is transparent and can be compared through time.
| Measure | Jul 2007 | Dec 2021 | Oct 2022 | 24 Sep 2026 |
|---|---|---|---|---|
| Shiller CAPE | 27.4 | 38.3 | 27.1 | 41.0 |
| CAPE earnings yield | 3.65% | 2.61% | 3.69% | 2.44% |
| 10-year TIPS real yield | 2.64% | −0.99% | 1.59% | 2.85% |
| Gap, CAPE basis | +1.01 | +3.60 | +2.10 | −0.41 |
| FactSet forward 12-month P/E | — | 21.2 | 15.6 | 19.1 (18 Sep) |
| Gap, forward basis | — | +5.70 | +4.68 | +2.63 (18 Sep) |
CAPE and TIPS figures for 2007, 2021 and 2022 are monthly averages; the September 2026 CAPE is Shiller’s value for the month scaled to Thursday’s close. Forward P/E ratios are from FactSet’s Earnings Insight of 17 December 2021, 21 October 2022 and 18 September 2026, each paired with the TIPS yield of the previous trading day. Gaps are in percentage points.
On smoothed earnings: the thinnest reading since at least 2003
Across the 285 months from January 2003 to September 2026, the CAPE-based gap had never been negative before. Its median was +2.97 points. It peaked at +5.80 in March 2009, when stocks were cheap and real yields modest. The previous thin patch was 2006–2007, with a 2007 average of +1.45 points; that has now been undercut for three years running, with averages of +0.94 in 2024, +0.74 in 2025 and +0.47 so far in 2026. The CAPE itself, at 41.0, has been higher in only 19 months since 1881: eighteen of them in 1999–2000 and one, last month.
On forward earnings: thin, not negative
FactSet’s forward 12-month P/E was 19.1 on 18 September, below its own five-year average of 19.8 and close to its ten-year average of 19.0. That puts the forward earnings yield at 5.24% and the gap over TIPS at 2.63 points; with Thursday’s 2.85% real yield it is 2.39. A rough benchmark: at FactSet’s ten-year average P/E, the forward earnings yield is 5.26%, and the 10-year TIPS yield averaged 0.78% over those ten years. On that basis the ten-year norm is about four and a half points. The gap is now a little over half of that.
Why the two measures disagree
The disagreement is about earnings, not prices. CAPE divides price by ten years of inflation-adjusted earnings, so a fast rise in profits takes years to show up. Profits are rising fast: FactSet expects third-quarter earnings growth of 28.9%, which would be the third straight quarter above 25%. Forward P/E, on the other hand, divides by what analysts expect over the next twelve months. A third measure sits in between. On trailing twelve-month reported earnings, the latest month Shiller’s file covers (June 2026) gives a gap of +1.79 points, lower than in 86% of months since 2003. The lowest trailing readings came in 2009, when earnings collapsed, not when prices were high.
The practical consequence: whether stocks still pay a premium over a risk-free real return depends on whether the last three quarters of earnings are the new base or a peak. That is a question about profits, not about the Fed, and nobody can answer it from a valuation ratio.
It was the real yield, not the multiple
Between December 2021 and Thursday, the CAPE-based gap fell by 4.01 points. The earnings yield accounts for 0.17 of that; the rise in the TIPS yield, from −0.99% to 2.85%, accounts for 3.84. Since January 2026, the gap has fallen by 1.02 points, of which 0.94 is the real yield. Valuations were already extreme four years ago. What changed is that the alternative stopped paying nothing. Why real yields rose rather than inflation expectations is the subject of our piece on term premiums and bond supply.
The arithmetic also shows the size of the move back to zero. All else equal, the CAPE-based gap returns to zero if the index falls 14.3%, or if the 10-year real yield falls back to 2.44%.
What history says about a thin premium, and what it does not
The Treasury’s constant-maturity TIPS yield series used here starts in 2003, and a 10-year outcome is only known for starting months up to September 2016. That is 165 overlapping windows, or about one and a half independent decades: too few to test anything. For a longer view we use Shiller’s own version of the same idea, the excess CAPE yield: the CAPE earnings yield minus a real bond yield that Shiller estimates as the 10-year Treasury yield minus the previous ten years’ annualised inflation. It runs from 1881. Because that real-rate proxy looks backwards, it is lower than the TIPS yield today: Thursday’s 5.18% minus 3.30% of past inflation is 1.88%, against 2.85% on TIPS. So on Shiller’s measure the premium is still positive, at +0.56%, but that is lower than in 87% of months since 1881 and the lowest since March 2002.
| Starting excess CAPE yield | Start months | Median real return, next 10 years | Worst | Best | Windows below zero | Median gap over Treasuries | Windows behind Treasuries |
|---|---|---|---|---|---|---|---|
| Thinnest fifth (−2.6% to 1.0%) | 326 | 5.1% | −5.9% | 11.0% | 20.2% | +0.8 | 43.9% |
| Second (1.0% to 2.6%) | 326 | 4.8% | −4.0% | 16.1% | 17.2% | +2.7 | 16.3% |
| Middle (2.6% to 4.9%) | 325 | 6.3% | −4.6% | 15.8% | 9.8% | +5.7 | 6.2% |
| Fourth (4.9% to 8.1%) | 326 | 8.1% | −4.2% | 14.3% | 12.0% | +3.9 | 2.8% |
| Widest fifth (8.2% to 23.5%) | 326 | 12.0% | 1.8% | 20.0% | 0.0% | +10.8 | 4.9% |
Monthly start dates from January 1881 to September 2016. Returns are annualised real total returns of the S&P Composite over the following 120 months, from Shiller’s data; the gap over Treasuries is the stock return minus the real total return on 10-year Treasuries in the same file, in points a year. Today’s 0.56% falls in the thinnest fifth.
Three things stand out. First, a thin premium has not meant poor absolute returns on average. The median real return from the thinnest fifth was 5.1% a year, about the same as from the second fifth, and the order is not even monotonic. Second, the range is wide: from −5.9% to +11.0% a year from the same starting band. September 1929 and December 1999 both started with a negative excess CAPE yield and were followed by real losses over ten years. June 1892 had the lowest reading in the data and was followed by 7.2% a year. Third, and clearest: the premium has said more about stocks against bonds than about stocks on their own. From the thinnest fifth, stocks trailed Treasuries in 43.9% of ten-year windows. From the widest fifth, 4.9%.
The statistics deserve the same scepticism. A straight line through all 1,629 start months explains about a third of the variation in ten-year returns (R² = 0.33), but consecutive months share nine years and eleven months of the same outcome, so the real sample is about 14 independent decades. Take one start month every ten years and the fit varies from almost nothing (R² = 0.03) to strong (0.65) depending only on which month you start from. Nineteenth-century earnings and interest-rate data are also far rougher than today’s. None of this lets anyone say what the next ten years will return. It says that the distribution of outcomes from a starting point like this one has been wide and has leaned towards bonds.
What to watch next
- This week — end of Xi Jinping’s state visit. Treasury Secretary Scott Bessent said on 23 September that the US–China trade truce due to expire on 10 November will be extended to 10 January 2027. A two-month extension moves the deadline; it does not settle it.
- Wednesday 30 September — August PCE inflation and the third estimate of second-quarter GDP. Both at 8:30 a.m. ET. The real yield is the part of the 5.18% that matters most for stocks; a firmer inflation print would strengthen the case for another Fed increase.
- Friday 2 October — September employment report. A weak number is the most direct route to lower real yields, which would widen the gap without any fall in stock prices.
- Tuesday 6 to Thursday 8 October — 3-year, 10-year and 30-year auctions, with the 10-year reopening on 7 October and the 30-year on 8 October. In September the 10-year cleared at 4.834% and the 30-year at 5.308%. How much demand shows up at yields near 5% will say whether buyers need still higher yields to absorb the supply.
- Wednesday 14 October — September CPI, and, through October, third-quarter earnings reports, which will test FactSet’s 28.9% growth estimate: the forward measure above leans entirely on it.
- 27–28 October — next FOMC meeting. The September projections pencilled in one more quarter-point increase this year.
What this changes for a portfolio
Not what to buy. It changes the questions worth asking of an existing allocation.
- What is the hurdle? A 10-year TIPS held to maturity returns 2.85% a year above inflation, before tax. An equity allocation is justified by what you expect above that, not above zero. The way interest rates reset the hurdle for every asset applies here with unusual force.
- What is the equity case resting on? On smoothed earnings there is no cushion. On forward earnings there are about two and a half points. The difference is whether current profits hold. That makes the equity share a bet on earnings, and it helps to size it as one.
- Does the bond side still do its job? A thin premium has historically favoured bonds relative to stocks more than it has predicted stock losses. That is an argument for checking whether the bond sleeve of a 60/40 portfolio is where your plan says it should be, not for abandoning equities.
- What is left after costs? When the expected premium is two points rather than five, a one-point fee takes half of it. The case for low-cost index funds, set out in our SPIVA review, gets stronger as premiums get thinner.
- Could you sit through a drawdown? A premium this thin leaves less room for disappointment. The history of bear markets since 1950 is a better guide to that than any valuation ratio, and so is judging returns per unit of risk, as the Sharpe ratio does.
What this does not say
It does not say stocks will fall, or when. The CAPE-based gap was thin for most of 2024 and 2025 while the index kept rising, and valuation measures have long periods in which they are simply wrong about timing. It does not say the forward measure is the right one: analysts’ estimates can be revised sharply, and this year they have moved up: FactSet’s forward earnings estimate rose 8.8% between 30 June and 17 September. It does not say bonds are safe. A 10-year TIPS protects against inflation, not against a further rise in real yields, which would cut its market price before maturity. And it is not a recommendation to buy or sell any security. For assets that held up in past shocks, see our crisis-proof investments review.
Frequently asked questions
What is the equity risk premium right now?
It depends on the measure. Using Shiller’s CAPE, the S&P 500 earnings yield of 2.44% minus the 2.85% real yield on 10-year TIPS gives −0.41 points on 24 September 2026, the first negative reading since at least 2003. Using FactSet’s forward P/E of 19.1, the gap is about 2.4 points.
Is the stock market overvalued compared with bonds?
On smoothed earnings, stocks now yield less than an inflation-protected Treasury. On forward earnings the gap is still positive but about half its ten-year norm. Most of the change since 2021 came from higher real yields, not from higher stock prices.
What is the Shiller CAPE ratio today?
About 41.0 at the 24 September 2026 close, scaling Shiller’s September value to that day’s price. It has been higher in only 19 months since 1881: eighteen in 1999–2000 and August 2026.
Does a low equity risk premium predict a crash?
Not on the historical record. Since 1881 the thinnest fifth of excess CAPE yields was followed by a median real return of 5.1% a year over ten years, with a range from −5.9% to +11.0%. What it has done more consistently is favour bonds: stocks trailed Treasuries in 43.9% of those ten-year windows.
Why is the 10-year Treasury yield at its highest since 2007?
The 10-year closed at 5.18% on 24 September 2026, the highest since 6 July 2007. The rise has come from the real yield, now 2.85%, while breakeven inflation stayed near 2.3%.
What is the difference between CAPE and forward P/E?
CAPE divides the index by the average of the last ten years of inflation-adjusted earnings. Forward P/E divides it by analysts’ estimates for the next twelve months. When earnings are growing fast, as now, CAPE looks far more expensive than forward P/E.
Sources
- US Treasury, daily par yield curve rates and daily par real yield curve rates, 2026 to 24 September; 1990–2025 files checked for every “highest since” date.
- Federal Reserve Bank of St. Louis, FRED, DFII10, 10-year Treasury inflation-indexed security, constant maturity, daily, January 2003 to 23 September 2026.
- Robert J. Shiller, stock market data used in Irrational Exuberance (ie_data.xls, file dated 2 September 2026): monthly S&P Composite prices to September 2026 (1 September close), earnings to June 2026, CAPE, excess CAPE yield and real total returns from 1871.
- FactSet, Earnings Insight, 18 September 2026, 21 October 2022 and 17 December 2021 (forward 12-month P/E, averages and Q3 2026 growth estimate).
- Federal Reserve, FOMC statement and Summary of Economic Projections, 16 September 2026, and meeting calendar.
- TreasuryDirect, auction results (5-year, 23 September; 7-year, 24 September; 10-year and 30-year, 9–10 September 2026) and US Treasury tentative auction schedule.
- US Bureau of Economic Analysis, release schedule; US Bureau of Labor Statistics, October 2026 release calendar.
- S&P 500 closing levels: Yahoo Finance (^GSPC), 13 August and 24 September 2026.
- Trade truce extension: NBC News, 23 September 2026, quoting Treasury Secretary Scott Bessent.
Related reading
- The 4% rule at CAPE 40 — what a valuation this high has meant for retirees’ safe withdrawal rates since 1871, and what a TIPS ladder pays at these real yields.
- The 10-year Treasury at 5% — why the rise came from real yields rather than inflation expectations.
- Why bond yields rise when central banks cut rates — term premium and supply, the mechanics behind higher real yields.
- How interest rates shape investment choices — what a higher real rate changes, asset by asset.
- Is 60/40 still alive? — what the bond sleeve does when yields are this high.
- Bear markets since 1950 — how deep and how long, and why the answer depends on the earnings.
- Index funds vs active management — why costs matter more when premiums are thin.
This article is general information, not personalised investment advice. It does not take into account the financial situation, objectives or risk tolerance of any individual reader, and the same text is distributed to all readers. Market data describe the dates stated and change continuously; historical relationships between valuations and returns are unstable, and past performance does not indicate future results. Capital is at risk.