Japanese Government Bonds at 3%: Who Buys Japan’s Debt After the BOJ
Key takeaway
The 10-year JGB closed at 3.07% on 24 September 2026, the highest since 1996, while the BOJ's policy rate is 1.25%. The Bank still holds 47.9% of JGBs and is shrinking that stake, and a 10-year Treasury hedged into yen now yields 2.30%, below the JGB, as it has every day since June 2022.
For most of the last thirty years, Japanese government bonds were the one market where nothing happened. The 10-year yield sat near zero, the Bank of Japan bought whatever the government issued, and the only interesting question was how negative the short end could go. That market is gone. On 24 September 2026 the 10-year JGB closed at 3.07%, the highest close on the Ministry of Finance’s series since 27 August 1996. On the same series, the 30-year and 40-year both closed at records on 1 September, above 4.1%, the highest since each maturity was first issued.
The usual story is the Bank of Japan’s rate hikes: it raised its policy rate to 1.25% on 18 September, the second increase in three months. That is the smaller half of the story. The 10-year yield sits 1.82 percentage points above the policy rate, and the rate the market implies for five-year money five years from now is about 3.75%, three times today’s policy rate. The larger half is about who owns the bonds. At the end of March the Bank of Japan still held 47.9% of all JGBs, and it is shrinking that position by design. The investors replacing it are more sensitive to price. And the same arithmetic that makes JGBs attractive to them is quietly changing the math for the largest foreign holder of US Treasuries.
Where Japanese yields stand
| Measure | End-2021 | End-2024 | 24 Sep 2025 | 24 Sep 2026 |
|---|---|---|---|---|
| BOJ policy rate | −0.10% | 0.25% | 0.50% | 1.25% |
| 2-year JGB | −0.10% | 0.60% | 0.93% | 1.91% |
| 10-year JGB | 0.09% | 1.11% | 1.66% | 3.07% |
| 30-year JGB | 0.69% | 2.25% | 3.07% | 4.12% |
| 40-year JGB | 0.76% | 2.56% | 3.33% | 4.10% |
| 10-year JGB minus policy rate | 0.19 pts | 0.86 pts | 1.16 pts | 1.82 pts |
Yields are the Ministry of Finance’s daily interest-rate series; the policy rate is the Bank of Japan’s guideline for the overnight call rate, with the September increase effective from 24 September. The 10-year yield rose 1.42 points in the last twelve months alone, more than in the entire decade before it.
Two things stand out in the table. First, the long end moved before the short end did. The 30-year yield had already passed 2% at the end of 2024, when the policy rate was 0.25%. Second, the curve is unusually steep and slightly humped: on 24 September the highest yield on the curve was the 25-year, at 4.14%, above both the 30-year and the 40-year.
The Bank of Japan is hiking, but that is not what moved the long end
The Bank of Japan’s path this year has been gradual. It held at 0.75% through April, with board members dissenting in favour of a hike. It raised to 1.0% on 16 June and to 1.25% on 18 September. The September vote was 7–2, and the two dissenters wanted no hike at all, arguing that consumer-price inflation excluding fresh food had recently been below 2%. The statement said the Bank “will continue to raise the policy interest rate”. It still described real interest rates as being “at low levels, mainly in the short- to medium-term zone”. In the Bank’s own words, 1.25% is still accommodative.
A policy rate of 1.25% does not by itself explain a 10-year yield of 3.07% or a 30-year yield above 4%. A rough way to see what the long end is pricing is to split the curve into forward rates. Using the Ministry of Finance’s 5-year and 10-year yields, the implied five-year rate starting five years from now is about 3.75%. The implied ten-year rate starting twenty years from now is about 4.6%. Either the market expects the Bank of Japan to take its policy rate far above anything it has signalled, or investors are demanding a large premium to lock up money for a long time. The second reading fits better with what the Bank itself has published.
In an August 2026 review of its bond-purchase reductions, the Bank of Japan’s staff concluded that the rise in long-term rates has been “driven, to a certain extent, by fundamental factors such as the rise in the underlying inflation”. It also pointed to a second channel. The Bank’s earlier review of its policy, in December 2024, estimated that its bond buying had held long-term rates down by up to about one percentage point since yield-curve control began in 2016. The August review found statistical evidence that this “stock effect” is now unwinding as the Bank’s share of the market falls. Put simply, part of the yield increase is the removal of a discount the Bank used to supply.
Fiscal policy has added to the pressure at the far end. On 20 January the prime minister called a snap election and floated a two-year suspension of the consumption tax on food. The 30-year yield on the Ministry of Finance’s series jumped about 20 basis points that day, from 3.56% to 3.77%. The 40-year rose from 3.72% to 3.90%. Moves of that size in one session were rare while the Bank was absorbing most new supply. They are what the long end of a curve looks like when its biggest buyer is stepping back.
Who owns Japan’s debt now
| Holder (end-March 2026, preliminary) | Trillion yen | Share of JGBs |
|---|---|---|
| Bank of Japan | 485.4 | 47.9% |
| Insurance companies | 155.3 | 15.3% |
| Banks (incl. Japan Post Bank, investment trusts, brokers) | 149.7 | 14.8% |
| Foreign investors | 82.0 | 8.1% |
| Public pensions | 73.4 | 7.2% |
| Pension funds | 31.7 | 3.1% |
| Households | 20.0 | 2.0% |
| Others and general government | 16.1 | 1.6% |
| Total JGBs (excluding Treasury bills) | 1,013.8 | 100% |
Source: Ministry of Finance, based on the Bank of Japan’s Flow of Funds Accounts (preliminary, 25 June 2026). Including short-term Treasury bills, foreigners hold 13.7% of the total, because they own more than half of all bills.
Before July 2024 the Bank of Japan was buying close to 6 trillion yen of JGBs a month. Under the plan it reaffirmed in June 2026, purchases fall by about 200 billion yen each quarter: about 2.5 trillion a month in July–September 2026, 2.3 trillion in October–December and 2.1 trillion in January–March 2027. From April 2027 they settle at about 2 trillion yen a month, roughly a third of the old pace. Because maturing bonds are no longer fully replaced, the Bank’s holdings shrink. It projects about 480 trillion yen by March 2027 and 350–370 trillion by March 2030, a fall of 36–39% from June 2024.
The August review accounts for who has taken up the slack. Between June 2024 and March 2026 the Bank’s holdings fell by 49 trillion yen while the stock of JGBs grew by 46 trillion, so other investors had to absorb 95 trillion yen. Banks, pension funds, foreign investors and households all bought. Life insurers, the natural owners of super-long bonds, did not. Their holdings fell by 5 trillion yen after they had finished buying long bonds to meet new solvency rules. Foreign investors added 27 trillion yen, with the increase concentrated in super-long maturities. At the end of 2025 they accounted for just under 50% of cash JGB trading and more than 70% of JGB futures trading.
That shift matters more than any single rate decision. A central bank buying to hit a target does not care about price. A foreign asset manager, a hedge fund or a Japanese bank managing interest-rate risk does. The long end of the JGB curve now has to be priced to attract them, and the clearest sign of that is where the 25-to-40-year yields sit.
Why foreign investors are buying: the hedged arithmetic
The Bank of Japan’s review offers a one-line explanation for the foreign buying. Once currency hedging is included, super-long JGBs yield more than super-long US or European government bonds of the same maturity. We checked that claim against daily data for the US and Japanese curves back to 2019. It holds, and not only at the long end.
The method is standard covered-interest arithmetic. A Japanese investor who buys a Treasury and hedges the dollars back to yen with one-year forwards gives up roughly the gap between one-year dollar and one-year yen rates. On 24 September that gap was 2.88 percentage points: a one-year Treasury at 4.51% against a one-year JGB at 1.63%.
| 24 September 2026 | 10-year | 30-year |
|---|---|---|
| US Treasury yield | 5.18% | 5.47% |
| Minus one-year hedge cost into yen | −2.88 pts | −2.88 pts |
| Treasury yield hedged into yen | 2.30% | 2.59% |
| JGB yield | 3.07% | 4.12% |
| Hedged Treasury minus JGB | −0.78 pts | −1.53 pts |
Our calculation uses the US Treasury’s daily par yield curve and the Ministry of Finance’s JGB series, with the one-year yield gap used as the hedge cost. It leaves out transaction costs and the cross-currency basis. The yen basis has typically been negative, which makes hedging dollars back into yen more expensive, so including it would widen the gap in the last row rather than close it.
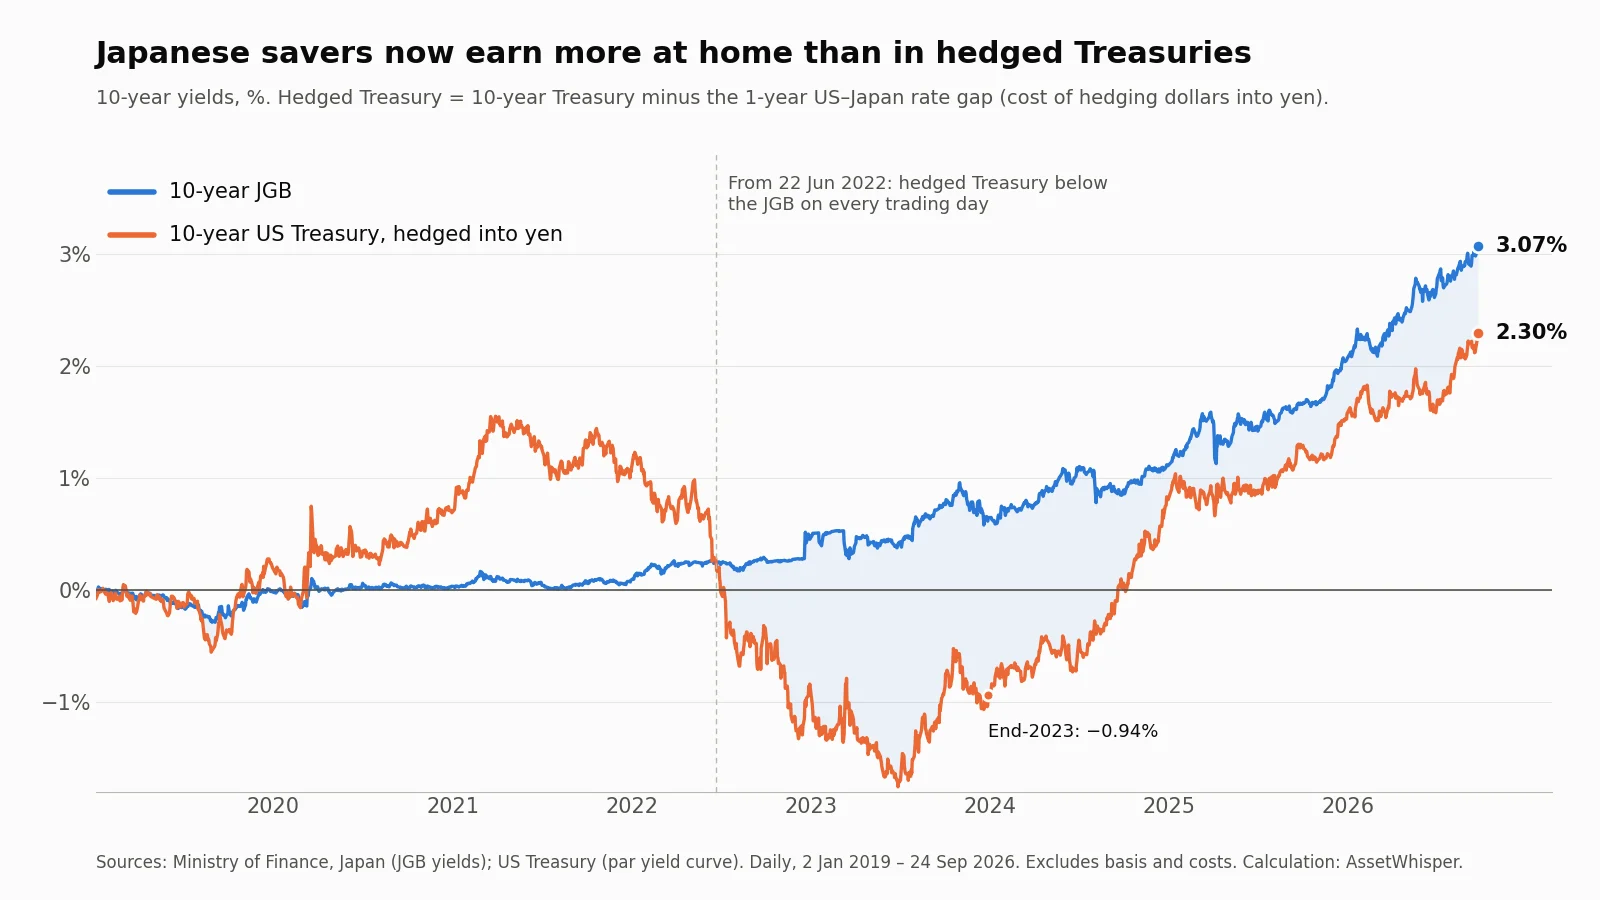
The hedged Treasury has yielded less than the JGB of the same maturity on every trading day since 22 June 2022, for both the 10-year and the 30-year. So the hedged comparison is not new. What is new is the level. At the end of 2023 a hedged 10-year Treasury yielded less than zero, about −0.9%, and the JGB alternative paid 0.65%. Neither was worth owning, so Japanese institutions that wanted yield bought Treasuries unhedged and accepted the currency risk. Today the domestic option pays 3.07% at ten years and 4.12% at thirty, with no currency risk at all.
The unhedged trade has also become less rewarding. The extra yield a Japanese investor earned by holding a 30-year Treasury unhedged instead of a 30-year JGB averaged 2.61 points in 2023. It fell to 1.92 points in 2025 and has averaged 1.25 points so far in 2026, with 1.35 points on 24 September. That 1.35 points is the entire annual reward for taking on the yen’s swings, and it covers a yen rise of only about 1.35% a year. This year the dollar has traded between 152.6 and 163.9 yen. In late July, Japan and the United States carried out their first coordinated yen-buying intervention since 1998. Between the Federal Reserve’s noon rates of 29 and 30 July the dollar fell from 163.86 to 159.47 yen, a 2.7% move in one day, twice the annual cushion. It was back near 157 on 18 September and about 159 intraday on 24 September. The 2026 average is the thinnest reward for unhedged Treasuries since 2020.
The practical consequence: Japan held $1,103.9 billion of US Treasuries at the end of July 2026 and is still the largest foreign holder. It had held $1,239.3 billion in February. Part of that drop is valuation, because the US figures are market values and Treasury prices fell as yields rose, so it is not proof of selling. But the direction of the incentive is clear. Every rise in JGB yields makes the domestic market a better home for money that used to go abroad. That adds to the pressure on Treasury yields we described in our piece on the 10-year at 5%.
The mirror image for dollar-based investors
The same arithmetic runs the other way. A dollar-based investor who buys a 10-year JGB and hedges the yen back to dollars receives the rate gap instead of paying it. Before basis and costs, that works out to about 3.07% plus 2.88 points, or roughly 5.96%, against 5.18% on the 10-year Treasury. Two cautions apply. The hedge is rolled every year, so the pickup lasts only as long as the gap between US and Japanese short rates. If the Fed cuts or the Bank of Japan keeps hiking, it narrows. And it is a trade in duration: the JGB’s price still falls if Japanese yields keep rising, as the next section shows. For most individual investors the practical route to this exposure is a global government bond fund hedged to their home currency, and the relevant question is how much duration it carries, not which country it holds.
What the move did to bondholders
The sell-off has been costly for long-dated holders. Take a hypothetical 30-year JGB bought at par on 24 September 2021, when the Ministry of Finance’s 30-year yield was 0.676%. Five years later it has 25 years left to run, and the 25-year yield is 4.141%. At that yield the bond is worth about 46 per 100 of face value, a price loss of about 54%. The five years of coupons collected add back only about 3.4 points. That is a loss of roughly half the original investment on the safest domestic asset in Japan, for anyone who has to mark it to market. Hold it to maturity and the 100 comes back, but at a 0.676% coupon for the next 25 years. A 10-year JGB bought the same day is worth about 89 per 100 with five years left.
The same arithmetic applies from today’s starting point. The table shows how much a bond priced at par on 24 September would gain or lose if yields moved one full point at once. The last column shows the yield rise that would wipe out one year of coupon income.
| Bond (24 Sep 2026) | Yield | Modified duration | Yields +1 pt | Yields −1 pt | Rise that erases a year’s income |
|---|---|---|---|---|---|
| 2-year JGB | 1.91% | 2.0 | −1.9% | +2.0% | ~98 bp |
| 10-year JGB | 3.07% | 8.6 | −8.1% | +9.0% | ~36 bp |
| 30-year JGB | 4.12% | 17.1 | −15.3% | +19.4% | ~24 bp |
| 40-year JGB | 4.10% | 19.6 | −17.0% | +22.8% | ~21 bp |
| 10-year US Treasury | 5.17% | 7.7 | — | — | ~67 bp |
| 30-year US Treasury | 5.49% | 14.6 | — | — | ~38 bp |
Our calculation, for par bonds with semi-annual coupons; the income column is yield divided by duration and ignores roll-down. Treasury yields are for 25 September.
The last column is why higher yields do not by themselves make the long end safe. A 30-year JGB at 4.12% has about a 24-basis-point cushion. January’s single-session move ate most of that in one day. A Treasury at the same maturity has a cushion of about 38 basis points, because its starting yield is higher. We walk through the duration arithmetic in more detail in why bond yields rise when central banks cut rates.
What to watch next
- The Bank of Japan’s 29–30 October meeting. Under its usual quarterly schedule, the October meeting comes with a new Outlook Report and updated inflation forecasts. The September statement listed the Middle East, AI-related demand and “developments in foreign exchange rates” as the risks it is watching.
- Super-long auctions. With life insurers holding back, 20-, 30- and 40-year auctions show most clearly whether price-sensitive buyers are willing to take the supply. The Bank has said it will buy more, or run fixed-rate purchase operations, “in the case of a rapid rise in long-term interest rates”. That promise has not been tested at these levels.
- 160 yen per dollar. The currency and the bond market are linked. A weaker yen feeds imported inflation, which strengthens the case for hikes, and a 160 break would raise the odds of another intervention. The funding side of the yen carry trade also becomes more expensive with every hike.
- Japan’s holdings of Treasuries. The monthly US Treasury TIC report shows whether the Japanese total keeps falling. To separate selling from valuation, compare it with the change in Treasury prices over the same month.
- Fiscal plans. Any new supplementary budget or tax cut raises the question of how it is financed. The January move showed how quickly the 30- and 40-year sectors respond.
What this changes for a portfolio
For an investor outside Japan, the direct question is usually not whether to buy JGBs. It is what Japan’s bond market does to everything else.
- Global bond yields have lost an anchor. For years, near-zero JGBs pushed Japanese savings abroad and held global long-term yields down. That flow is weakening at the margin. It is one reason Treasury yields can stay high even when inflation expectations fall, the pattern we found in our equity risk premium analysis.
- Currency exposure in Japanese equities needs a deliberate choice. Our Nikkei piece explained why the yen can erase or double a foreign investor’s equity return. Rising JGB yields and intervention risk make that choice more consequential, not less.
- Duration is the risk, not the country. A hedged global bond fund can hold JGBs with an attractive hedged yield and still lose money if the long end keeps repricing. Check the fund’s duration against your own time horizon, as we set out in the 60/40 piece.
- Hedges cost more. Carry trades funded in yen and currency hedges into yen are both priced off the rate gap. Our guide to hedging costs covers how that cost shows up in returns.
What this does not say
It does not say JGB yields must keep rising, or that a Japanese debt crisis is coming. Japan’s debt is overwhelmingly held at home and denominated in its own currency. The Bank of Japan has kept, and said it will use, the power to buy more bonds in a disorderly market. It also does not say Japanese investors are selling Treasuries: the July holdings figure mixes price effects with transactions. And the hedged comparison uses one-year rates and ignores the cross-currency basis, so it shows the direction and rough size of the incentive, not the exact return any institution earns.
What it does say is that the price of long-term money in Japan is now being set by investors who care about price, for the first time in more than a decade. They are asking for about 3% at ten years and more than 4% at thirty. That level is already high enough to change where Japanese savings go.
Frequently asked questions
What is the 10-year Japanese government bond yield now?
3.07% at the close on 24 September 2026, on the Ministry of Finance’s series. It is the highest close since 27 August 1996. The yield first crossed 3% in trading on 1 September 2026.
Why are Japanese bond yields rising?
There are three reasons. Underlying inflation in Japan is close to 2% and the Bank of Japan has raised its policy rate to 1.25%. The Bank is also cutting its bond purchases, from nearly 6 trillion yen a month to about 2 trillion by April 2027, which removes a buyer that its own estimates say held long-term rates down by up to about one percentage point. And fiscal concerns, including proposed tax cuts, have pushed up the yields on 30- and 40-year bonds in particular.
How much of Japan’s government debt does the Bank of Japan own?
47.9% of JGBs (485.4 trillion yen out of 1,013.8 trillion) at the end of March 2026, according to preliminary Flow of Funds data. Nikkei Asia reported it as the first reading below half in three and a half years, and the Bank plans to reduce its holdings to 350–370 trillion yen by March 2030.
Do rising JGB yields affect US Treasuries?
Yes, through Japanese investors’ choices. Japan is the largest foreign holder of Treasuries, with $1,103.9 billion at the end of July 2026. On 24 September a 10-year Treasury hedged back into yen yielded about 2.30%, against 3.07% on a 10-year JGB. The unhedged pickup on 30-year bonds has shrunk from an average of 2.61 points in 2023 to 1.35 points. Both changes make it less attractive for Japanese money to stay in Treasuries.
Can a US investor earn more on hedged JGBs than on Treasuries?
Before the cross-currency basis and costs, a 10-year JGB hedged into dollars yielded about 5.96% on 24 September, against 5.18% on a 10-year Treasury, because the dollar investor receives the gap between US and Japanese short rates. That gap is reset each time the hedge is rolled, and the bond still carries Japanese interest-rate risk, so the extra yield is not locked in.
When is the next Bank of Japan meeting?
29–30 October 2026. Under the Bank’s usual quarterly schedule, it comes with a new Outlook Report on economic activity and prices.
Sources
- Ministry of Finance, Japan, JGB interest rates: historical series (1974 to August 2026) and current-month data (September 2026). All JGB yields, records and forward rates in this article are our calculations from these files.
- Bank of Japan, Change in the Guideline for Money Market Operations, 18 September 2026; the same release for 16 June 2026; and the statements of 19 March, 28 April and 31 July 2026.
- Bank of Japan, Plan for the Outright Purchases of Japanese Government Bonds, 16 June 2026 (monthly purchase amounts and projected holdings).
- Bank of Japan, Impact of the Bank of Japan’s Reductions in JGB Purchases on the JGB Markets, Bank of Japan Review 2026-E-10, August 2026 (changes in holdings by investor type, foreign share of trading, the stock effect).
- Ministry of Finance, Japan, Breakdown by JGB and T-Bill Holders, March 2026, preliminary, based on the Bank of Japan’s Flow of Funds Accounts of 25 June 2026.
- Bank of Japan, Release schedule (Monetary Policy Meeting of 29–30 October 2026).
- US Treasury, daily par yield curve rates, 2019 to 2026, and TIC Table 5, Major Foreign Holders of Treasury Securities (data to July 2026).
- Federal Reserve Board, H.10 noon buying rates via FRED (DEXJPUS), yen per dollar, 2026 to 18 September (range, 29–30 July move). Intraday level and intervention context for 24 September: Bloomberg, 24 September 2026; joint US–Japan intervention: The Japan Times, 3 August 2026.
- BOJ share below 50%: Nikkei Asia. First 3% print on the 10-year JGB: The Japan Times, 1 September 2026. Snap election and consumption-tax proposal on 20 January: The Japan Times, 20 January 2026.
Related reading
- The 10-year Treasury at 5% — why the US rise is in real yields, not inflation.
- Why bond yields rise when central banks cut rates — term premium and duration, explained from first principles.
- Equity risk premium and real yields — what higher real bond yields do to stock valuations.
- Nikkei 225 at record highs — Japanese equities and the yen question for foreign investors.
- How interest rates shape investment choices — asset by asset.
- Portfolio hedging strategies: what each one costs — including currency hedges.
This article is general information, not personalised investment advice. It does not take into account the financial situation, objectives or risk tolerance of any individual reader, and the same text is distributed to all readers. Market data describe the dates stated and change continuously; past performance does not indicate future results. Capital is at risk.