Position Sizing: The Part of a Trading System That Decides Whether It Survives
Key takeaway
Position sizing determines whether being wrong is a setback or an ending, and it outranks security selection. Consecutive losses compound faster than intuition suggests: risking too much per trade makes ruin likely even with a genuine edge, because the arithmetic of recovery works against an account that has already shrunk.
Most people who lose money in the market do not lose it because their strategy was wrong. They lose it because they were too big in the one trade where it was wrong. Position sizing — how much capital goes into each trade — decides whether a good strategy survives long enough to pay off, and it is the part of a trading system that gets the least attention.
The uncomfortable part is that the maths is not symmetric, and that asymmetry is where most accounts die.
Why losses hurt more than equivalent gains help
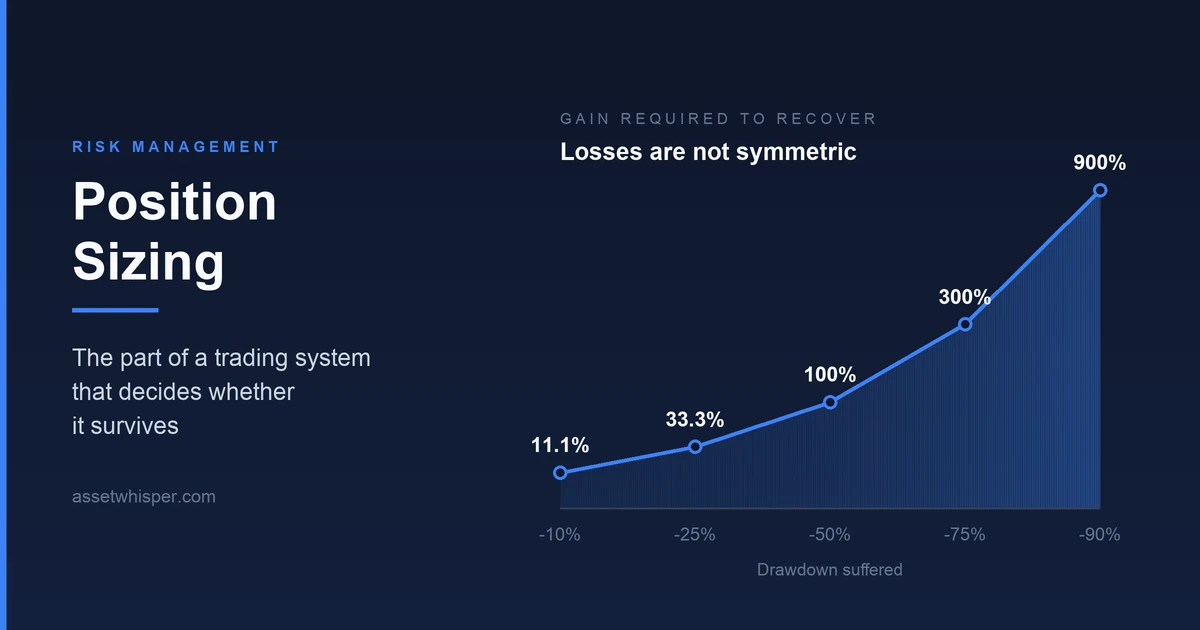
A 50% loss requires a 100% gain to get back to where you started. That sentence is familiar enough to have lost its force, so it is worth seeing the whole curve:
| Drawdown | Gain needed to recover | What that means in practice |
|---|---|---|
| 10% | 11.1% | A normal bad month. Recoverable. |
| 25% | 33.3% | A bad year. Still recoverable. |
| 50% | 100% | You must double what is left. Few strategies do that. |
| 75% | 300% | Effectively terminal for most accounts. |
| 90% | 900% | Not a drawdown. An ending. |
The curve is convex, and that is the whole point: the cost of a loss grows faster than its size. This is why capital preservation is not conservatism — it is arithmetic. A strategy that returns less but never draws down 50% will outperform a better one that does, because the better one has to spend years climbing back to level ground.
Risk of ruin: the number nobody calculates
Two systems can have identical expected returns and completely different survival odds. What separates them is how much is risked per trade relative to how often the strategy is wrong.
Consider a strategy that wins 55% of the time with equal wins and losses — a genuinely good edge. The probability of a severe drawdown depends almost entirely on position size:
| Risk per trade | Consecutive losses to lose half the account | Odds of that streak occurring |
|---|---|---|
| 1% | ~69 trades | Vanishingly small |
| 2% | ~35 trades | Very unlikely |
| 5% | ~14 trades | Uncommon, but it happens |
| 10% | ~7 trades | Expected within a few hundred trades |
| 25% | ~3 trades | A near certainty over time |
A seven-loss streak in a strategy that is wrong 45% of the time is not a disaster scenario. It is an ordinary Tuesday, statistically speaking — it will happen, repeatedly, to anyone who trades long enough. At 1% risk it is an irritation. At 10% it is the end of the account.
Fixed fractional sizing, and its two failure modes
The standard answer is fixed fractional sizing: risk the same percentage of current equity on every trade. It has one elegant property — as the account shrinks, position sizes shrink with it, which makes complete ruin mathematically difficult.
It also has two failure modes that are worth naming, because both are common:
- Confusing position size with risk. Putting 2% of capital into a position is not the same as risking 2%. If the stop is 20% away from entry, a 10% position risks 2%. The number that matters is the distance to the exit, not the size of the position.
- Ignoring correlation. Five positions at 2% each in five different technology stocks is not five independent bets of 2%. In a sector-wide selloff it behaves like one bet of 10%. Portfolio risk is not the sum of position risks when the positions move together — and they move together precisely when it matters most.
What the volatility of the asset should change
A fixed percentage of capital in a quiet utility stock and the same percentage in a volatile small-cap are not the same trade. Volatility-adjusted sizing corrects this by making the position size inversely proportional to how much the asset typically moves: the more it swings, the smaller the position, so that each position contributes roughly the same amount of risk to the portfolio.
The practical effect is that the portfolio stops being dominated by whatever happens to be its most volatile holding. Without this adjustment, one position quietly accounts for most of the account’s daily movement, and the diversification is nominal rather than real.
The rule that survives all of this
Strip away the formulas and one principle remains: size positions so that being wrong repeatedly is survivable. Not so that being right is maximally profitable — survivable when wrong.
A system that risks 1-2% per trade with attention to correlation will endure losing streaks that destroy a system with twice the edge and four times the position size. This is not a comfortable conclusion for anyone hoping to compound quickly, but it is the reason some strategies are still running after a decade and most are not.
For how these constraints shape strategy design from the start, see our guide to profitable algorithmic trading strategies.
One way to tie exposure to recent price behaviour is a trend rule; we tested the best-known one in the 10-month moving average on the S&P 500.
Frequently asked questions
What is position sizing?
Deciding how much capital a single idea gets. It determines whether being wrong is a setback or an ending, and it outranks security selection: a good strategy sized badly fails, while a mediocre one sized well survives long enough to compound.
What is risk of ruin?
The probability that a sequence of losses reduces an account below the point where it can recover. It depends on how often the strategy is wrong and, far more, on how much is risked per trade — two systems with identical expected returns can have completely different survival odds.
How much should I risk per trade?
Common practice among systematic traders is 1% to 2% of equity per position, and the reason is arithmetic rather than convention. At 1%, a seven-loss streak is an irritation; at 10% it is most of the account. Losing streaks that feel extreme are ordinary for any strategy wrong 45% of the time.
Why does a 50% loss need a 100% gain to recover?
Because the gain is earned on a smaller base. Half the capital must double to return to the starting point. The asymmetry worsens sharply beyond that: 75% down requires 300%, and 90% down requires 900%, which is why capital preservation is arithmetic rather than conservatism.
Is position size the same as risk?
No, and confusing them is the most common error here. Putting 10% of capital into a position with a stop 20% away risks 2% of the account, not 10%. The number that matters is the distance to the exit, not the size of the position.
Does diversification replace position sizing?
No. Five positions at 2% each in the same sector behave like one position of 10% when that sector sells off — and they move together precisely when it matters. Correlation has to be counted before the position sizes mean anything.
About this publication. This article is general information about portfolio construction methodology and is not personalised investment advice: it does not take into account the financial situation, objectives or risk tolerance of any individual reader, and the same text is distributed to all readers. It is not a recommendation to buy or sell any financial instrument. The author holds no position in any instrument mentioned. All figures are arithmetic illustrations of the methods described, not projections of future returns. Past performance does not indicate future results, and capital is at risk.