Lump Sum vs Dollar-Cost Averaging: What the Evidence Says About When to Invest
Key takeaway
Investing a lump sum immediately beat a three-month phase-in 68% of the time in Vanguard research, costing about $500 of expected return per $100,000 to spread it out. Dollar-cost averaging is not the return-maximising choice; it is insurance against regret, and the premium is small but real.
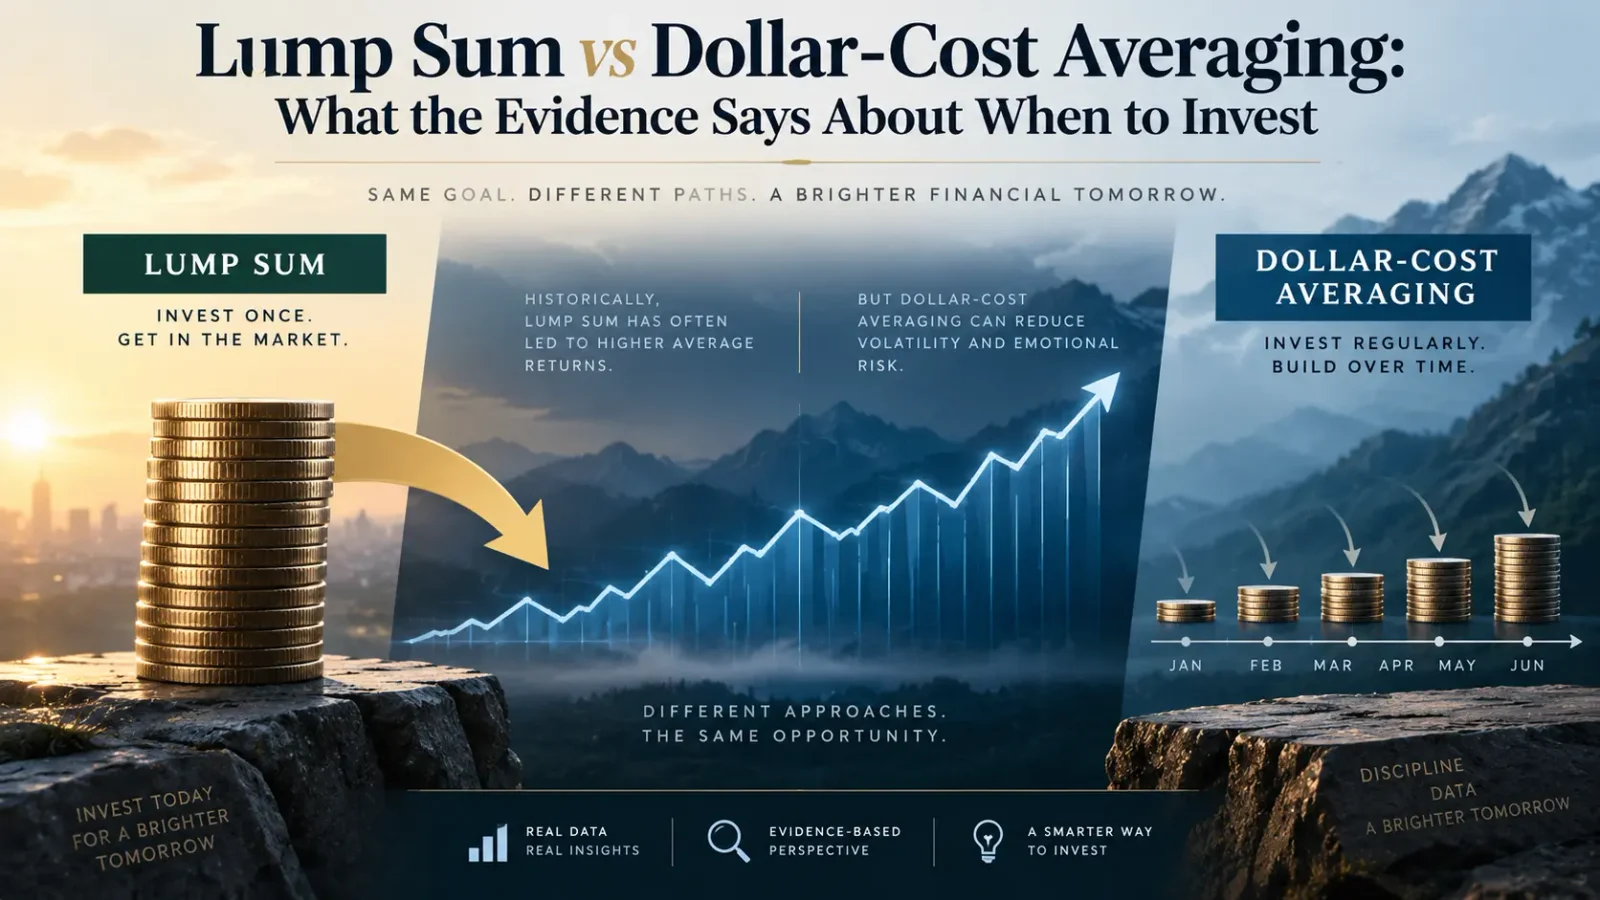
You have a sum of money — an inheritance, a bonus, the proceeds of a sale — and the standard advice is to feed it into the market gradually rather than all at once. That advice is wrong on the arithmetic and right on the psychology, and almost nobody says which of the two they are giving you.
The historical record is consistent on the arithmetic. In Vanguard’s 2023 study, investing a lump sum immediately beat splitting it into three monthly instalments 68% of the time across global equities, and between 61.6% and 73.7% of the time across individual markets and schedules of three to six months. Dollar-cost averaging is not the return-maximising choice. It is insurance, and this guide is about what that insurance costs, what it buys, and when it is worth paying for.
What the evidence actually shows
| Question | What the research finds |
|---|---|
| How often does investing immediately beat phasing in? | 68% of rolling one-year periods for global equities against a three-month schedule. Across the US, UK, Canada, Europe, Australia and emerging markets, and schedules of three to six months, the range is 61.6% to 73.7% |
| By how much? | After one year on a $100,000 starting sum, median wealth was 2.2% higher for a 100% equity portfolio, 1.8% for 60/40 and 1.2% for 40/60 |
| Why? | Cash underperforms. Between 1976 and 2022, US stocks beat three-month Treasury bills 76% of the time and bonds beat them 68% of the time. Money waiting to be invested gives up that risk premium |
| What does phasing in give you instead? | A lower portfolio risk during the transition, and better outcomes in the worst scenarios — below roughly the 25th percentile of results |
| Who is it rational for? | Investors with high loss aversion, who might otherwise leave the whole sum in cash. Vanguard notes phasing in still beat staying in cash 69% of the time |
The practical consequence: this is not a debate with a hidden right answer. Both sides are correct about different things. Investing immediately has the higher expected return; phasing in reduces the damage in the worst outcomes of the transition. Which matters more is a question about you, not about markets.
What Vanguard’s lump-sum vs dollar-cost averaging research found
“The Vanguard study” is usually quoted as if it were one paper. It is at least two, eleven years apart, and the numbers people repeat come from different ones: the “two-thirds” headline is from 2012, the 68% from 2023. They asked the same question with different designs — and landed within a few points of each other.
| Paper | Authors | Markets and data | Phase-in tested | Measured over | Headline result |
|---|---|---|---|---|---|
| Dollar-cost averaging just means taking risk later (July 2012) | Anatoly Shtekhman, Christos Tasopoulos, Brian Wimmer | US 1926–2011, UK 1976–2011, Australia 1984–2011; 100% equity to 100% bonds | 6 to 36 months (12 as baseline) | Rolling 10-year periods, $1,000,000 | Lump sum ahead in 67% (US), 67% (UK) and 66% (Australia) of periods for a 60/40 portfolio |
| Cost averaging: Invest now or temporarily hold your cash? (February 2023) | Megan Finlay, Josef Zorn | MSCI World 1976–2022, plus the US, UK, Canada, Europe, Australia and emerging markets over shorter windows | 3 to 6 months (3 as baseline) | Rolling one-year periods, $100,000 | Lump sum ahead in 68% of periods for global equities; 61.6% to 73.7% across markets and schedules |
2012: “Dollar-cost averaging just means taking risk later”
Shtekhman, Tasopoulos and Wimmer took a $1 million sum (£1 million in the UK, A$1 million in Australia) and compared investing it at once with moving it from cash into the portfolio in equal monthly steps over 6, 12, 18, 24, 30 or 36 months. The cash waiting to be invested earned the local cash rate, and both portfolios were then held to the end of a ten-year period, rolled month by month through the full history of each market.
- How often. With a 60/40 portfolio and a 12-month phase-in, the lump sum finished ahead in 67% of rolling ten-year periods in the US, 67% in the UK and 66% in Australia. At 100% equities the figures were 66%, 68% and 62%; at 100% bonds, 65%, 61% and 58%.
- By how much. In the US the average ending value was $2,450,264 for the lump sum against $2,395,824 for the 12-month phase-in, or 2.3% more. The UK gap was 2.2% and Australia’s 1.3%.
- Longer is worse. In the US, investing at once beat a 36-month phase-in in approximately 90% of the ten-year spans.
- Not just more risk. Over the first 12 months, the lump sum also had the higher average Sharpe ratio in every one of the nine market and allocation combinations tested — so the extra return was not merely payment for extra volatility.
- What phasing in bought. Of 1,021 rolling 12-month periods in the US, the lump-sum portfolio lost value in 229 (22.4%) and the phased portfolio in 180 (17.6%); the average loss in those periods was $84,001 against $56,947.
The title is the argument. Holding the money back does not remove the risk; it postpones taking it — and the authors point out that delaying investment is itself a form of market timing, something few investors succeed at.
2023: “Cost averaging: Invest now or temporarily hold your cash?”
Finlay and Zorn shortened everything: a three-month phase-in as the base case, a one-year measurement window, a $100,000 sum and, in the base case, no interest on the cash waiting to be invested. They added markets (Canada, Europe, emerging markets and a global index), 10,000 simulated return paths as a robustness check, and a utility model to test who should prefer phasing in. The result was the 68% hit ratio for global equities against a three-month split, with phasing in still beating cash 69% of the time and the lump sum beating cash 70% of the time. Crediting the waiting cash at the three-month Treasury bill rate brought the lump sum’s figure down to 65%. The rest of this article works through the 2023 figures in detail.
An earlier, shorter Vanguard note used almost the same title: Invest now or temporarily hold your cash? (Daniel B. Berkowitz and Andrew S. Clarke, October 2016). With a 60/40 portfolio phased in over 12 months and rolling 12-month periods, immediate investment led 68% of the time in the US (1926–2015), 70% in the UK (1976–2015) and 68% in Australia (1984–2015), and it recommended keeping any phase-in to no longer than a year.
The practical consequence: three designs — ten-year and one-year horizons, cash that earned interest and cash that did not, phase-ins from three months to three years — and the lump sum’s hit ratio lands between 58% and 74% in every table, except for the longest phase-ins: against 36 months it won about 90% of the time in the US. The two headline numbers are not a trend: 2012’s “two-thirds” and 2023’s 68% measure different things, and neither says the edge is growing or shrinking. What stays constant is the mechanism, which both papers name — cash earns less than the assets it is waiting to buy. And both note that the horizon changes the size of the gap, not the winner: once the phase-in ends the two portfolios hold the same allocation, so whichever is larger at that point stays ahead.
Why immediate investment usually wins
The mechanism is unglamorous: cash has an opportunity cost. Over 1976 to 2022, US stocks outperformed three-month Treasury bills in 76% of periods. Every month a euro sits in cash rather than in the market, it forgoes that risk premium — and the premium is the entire source of the gap between the two strategies.
The arithmetic is small but relentless. Split a sum into three monthly instalments and the second tranche misses one month of market exposure, the third misses two: on average each euro spends a month out of the market. Stretch the same sum over six instalments and the average rises to two and a half months. That is why Vanguard’s hit ratio for immediate investment rises as the schedule lengthens — in the US, from 66.4% against a three-month split to 73.7% against a six-month one. The longer you phase in, the more often you lose by it.
Note what this argument does not claim. It does not say the market will rise. It says that across many possible starting dates, more of them are followed by gains than losses — which is why phasing in loses roughly two-thirds of the time and wins the remaining third. In that third, it wins because the money not yet invested escaped a decline.
How often immediate investment won, by market and schedule
The pattern holds across every market Vanguard tested, and it strengthens as the phase-in gets longer. These are hit ratios — the share of rolling one-year periods in which investing the lump sum immediately produced more wealth than the schedule shown.
| Schedule | US | UK | Canada | Europe | Australia | Emerging | Global |
|---|---|---|---|---|---|---|---|
| 3 monthly tranches | 66.4% | 68.1% | 67.2% | 66.5% | 67.5% | 61.6% | 67.7% |
| 4 monthly tranches | 69.9% | 69.8% | 67.9% | 66.9% | 69.6% | 61.8% | 69.7% |
| 5 monthly tranches | 72.6% | 70.2% | 69.3% | 66.5% | 71.0% | 62.9% | 71.7% |
| 6 monthly tranches | 73.7% | 69.5% | 69.7% | 65.4% | 72.5% | 61.8% | 72.6% |
Two things to read out of it. Every cell is above 60%, in six markets across data windows starting between 1976 and 1998 — this is not an artefact of one index or one decade. And in most markets the ratio climbs as you go down the column: the longer the schedule, the more often you lose by using it.
Emerging markets are the mildest case at around 62%, which is what you would expect — the more volatile the market, the more often a phase-in happens to catch a decline. Even there, immediate investment still won roughly three times in five.
What you are actually buying by phasing in
Frame it as an insurance product and it becomes decidable.
The premium. In Vanguard’s simulations, on a $100,000 sum a three-month schedule ended the year with $504 less than investing immediately, and a six-month schedule with $1,491 less. That is an expected cost, not a worst case: in any individual instance the shortfall can be far larger, because a market that rises 20% during your phase-in period charges you 20% on the money you were holding back.
The cover. If markets fall sharply during the phase-in, later tranches buy at lower prices. In the worst 5% of historical one-year outcomes for a 100% equity portfolio, phasing in ended at $85,906 against $82,947 for investing immediately — around $3,000 better on $100,000. Vanguard’s summary of where the protection applies is precise: immediate investment wins in all but the worst outcomes, below roughly the 25th percentile.
The exclusion. The policy does not protect the money once it is invested. After the final tranche you hold exactly the same portfolio with exactly the same risk. Phasing in shortens your exposure to bad luck at one moment; it does nothing about the following thirty years.
Stated that way, the question is no longer “which is better” but: is an expected cost of roughly $500 on $100,000 a fair price for reducing the damage if you invest everything immediately before a sharp decline? For many people the honest answer is yes, and that answer is not irrational. It is a preference about regret, which is a real cost even though it does not appear in a return calculation.
What cash interest changes
Most versions of this argument assume the uninvested money earns nothing. When it earns something, the gap narrows.
Vanguard re-ran the analysis crediting the uninvested portion at the three-month Treasury bill rate, and immediate investment still won — but 65% of the time for an all-equity portfolio rather than 68%. Their finding generalises: as cash interest rises, the advantage of investing immediately shrinks, because the opportunity cost of waiting is exactly the spread between cash and the assets you are buying.
The practical consequence: the case for deploying immediately is strongest when cash pays little, and weakest when it pays a lot. It does not reverse — the risk premium on equities has historically exceeded the cash rate — but the size of the mistake changes with the rate environment, and so does how much the insurance is worth.
The distinction almost every article gets wrong
Most of the confusion in this debate comes from one conflation: investing regularly from income is not dollar-cost averaging.
If you invest €500 each month out of your salary, each €500 goes in as a lump sum the moment it exists. You never had the option of investing it earlier, because you did not have it earlier. There is no cash sitting idle and no expected return being forgone. That is simply investing, at the frequency your income allows.
Cost averaging in the sense the research examines is a specific and different decision: you already hold the whole sum, and you choose to keep part of it in cash. Vanguard draws exactly this line, noting that the term is also used for investing a fixed amount from each paycheck, and that their analysis instead examines “what to do with a lump sum that is available immediately”.
The practical consequence: if you invest from income, the studies showing immediate investment wins do not apply to you and no change is required. If you are holding a windfall in cash and wondering how to deploy it, they apply directly.
When phasing in is the right answer
| Situation | Reasonable approach | Why |
|---|---|---|
| You invest from monthly income | Invest as it arrives | Not the same decision. Nothing is being held back |
| You have a windfall, a long horizon, and you can watch a 20% fall without acting | Invest it | The odds and the arithmetic both favour it |
| You have a windfall and know you would panic and sell after an early loss | Phase it in, over a short window | A plan you will abandon is worse than a slightly costlier plan you will keep |
| The money is needed within a few years | Neither — reconsider the allocation | This is an asset allocation question, not a timing one. Equities are the wrong instrument for a short horizon |
| A large early loss would force you to sell — no emergency fund behind it | Build the buffer first, then invest | Being a forced seller converts volatility into permanent loss |
| The sum is very large relative to your existing portfolio | Phase in, and treat it as a sizing question | The issue is concentration in time, which is a position sizing problem |
Who should actually phase in — and how loss-averse you have to be
“It suits loss-averse investors” is where most articles stop. Vanguard put numbers on it, running a utility model over three investor profiles and comparing the two strategies by certainty equivalent — the guaranteed return an investor would accept instead of the uncertain one.
| Investor profile | Preferred without loss aversion | Preferred with loss aversion |
|---|---|---|
| Adventurous | Invest immediately | Invest immediately |
| Moderately conservative | Invest immediately | Phase in |
| Very conservative | Phase in | Phase in |
The interesting row is the middle one, and it is the only one that moves. The adventurous investor should invest immediately whether or not losses hurt disproportionately; the very conservative investor should phase in either way. For everyone in between, the decision is settled not by risk tolerance but by loss aversion — by whether a fall costs you more in distress than an equivalent gain returns in satisfaction. Vanguard modelled that penalty at 2.5 times, roughly the ratio the behavioural literature reports.
The practical consequence: the useful question is not “how much risk can I take?” but “how badly would an early loss hurt, relative to the pleasure of an early gain?” If the honest answer is much more, phasing in is the rational choice for you even though it has the lower expected return. If losses and gains feel roughly symmetrical, the arithmetic should decide. Our investor profile guide covers how to establish which you are before the money is at stake rather than during a drawdown.
If you do phase in, keep the schedule short
This part is not a matter of taste. The cost of phasing in scales with how long the money stays in cash, and Vanguard’s own figures show it: in the US the hit ratio for investing immediately climbs from 66.4% against a three-month split to 73.7% against a six-month one. Their conclusion is explicit — the longer the horizon over which you invest the cash, the greater the opportunity cost incurred.
Vanguard’s own conclusion is the same and unusually specific: for investors with high loss aversion who find phasing in more palatable, the opportunity cost should be minimised by keeping the period relatively short, such as three months. Set the dates in advance and execute them regardless of what the market does in between. The fixed dates are the point — a schedule you adjust according to how you feel about the market is not cost averaging, it is market timing with extra steps.
Where the arithmetic stops and judgement begins: how much reassurance the first tranches actually provide is a question about you, not something the research measures. If committing everything at a single price is what would stop you investing at all, the premium is worth paying. Vanguard makes the same point from the other direction — phasing in still beat holding cash 69% of the time, so it is a far better answer than paralysis.
The same logic if you never receive a windfall
Most people will not inherit a lump sum, but almost everyone makes a version of this decision annually without noticing it.
Pension and retirement contributions. If you contribute to a tax-advantaged account each year, contributing as early in the year as you can is the lump-sum strategy applied to a recurring decision. You forgo some interest on the cash in the first months, and in exchange the money spends longer in the market. Vanguard’s research points the same way here, and the effect compounds when it is repeated year after year.
Withdrawals in retirement. The argument runs in reverse when you are drawing money out. Taking a year’s spending as a lump sum at the start rather than withdrawing monthly means holding more cash and less invested — worse on expected return, but more secure if markets fall during the year. It is the same trade with the signs flipped.
Cash you have simply never deployed. This is the largest and least discussed version. Many investors hold too much cash not by decision but by deferral — postponing the question of how and when to invest until it stops being asked at all.
Schwab’s “Does Market Timing Work?” study: what waiting for a better price costs
Charles Schwab’s version of this research asks a neighbouring question. Not how to deploy a windfall, but when in the year to invest a sum you receive every year. The Schwab Center for Financial Research follows five hypothetical investors who each received $2,000 at the start of every year and invested it in the S&P 500; the one who never bought stocks held Treasury bills. The edition current as of September 2026 (dated 18 July 2025) covers the 20 years 2005–2024 — $40,000 contributed by each.
| Investor | What they did each year | Wealth after 20 years |
|---|---|---|
| Peter Perfect | Invested at the year’s lowest close | $186,077 |
| Ashley Action | Invested on the first trading day of the year | $170,555 |
| Matthew Monthly | Split the $2,000 into 12 monthly instalments | $166,591 |
| Rosie Rotten | Invested at the year’s highest close | $151,343 |
| Larry Linger | Stayed in Treasury bills, waiting for a better entry | $47,357 |
Three results are worth taking from it.
- Perfect timing was worth little. Twenty years of buying at the exact annual low produced $15,522 more than investing on the first trading day — about 9% more, from a skill nobody has.
- Cost averaging came third, close behind. Matthew’s monthly split finished $3,964 behind Ashley, the same direction as Vanguard’s findings: spreading the money out gave up a little to the investor who simply invested it.
- The only disaster was not investing. Rosie, who bought at every annual peak, still ended with about 3.2 times Larry’s total. The worst possible timing beat waiting for good timing by $103,986.
Schwab ran the same comparison over all 80 rolling 20-year periods since 1926. The ranking was identical — Peter, Ashley, Matthew, Rosie, Larry — in 70 of them. In the other ten, investing immediately came second four times, third five times and fourth once (1962–1981, a long stretch of weak equity markets), and it never came last.
The practical consequence: Schwab’s study is about recurring contributions, not windfalls, and it uses US large-cap stocks only, so it is evidence for the pension-contribution case above rather than new evidence on lump sums. Its sharpest point is the one Vanguard also makes: the gap between investing at once and averaging in is small next to the gap between either of them and waiting for a better price. Sitting in cash for the right moment, not buying at a bad one, is the investing mistake worth guarding against.
The question underneath both answers
Neither approach addresses the decision that matters more than either: what you are buying, and how much of your total wealth it represents.
An investor who deploys a windfall perfectly into an allocation that is wrong for their horizon has optimised the trivial variable. The order of operations is allocation first, then sizing, then timing — and timing is last because it is worth the least. Our guides to managing investment risk and portfolio construction in 2026 cover the first two, and your investor profile is where the horizon question gets settled.
There is also a reason this debate generates more heat than its stakes justify. Around $500 on $100,000, once, is a small number next to the cost of abandoning a plan in a drawdown — which is the failure that actually destroys returns, and the subject of behavioural finance.
Vanguard puts the point more bluntly than most fund research does: having a plan for investing the cash is the important part, and the choice between the two methods makes only a marginal difference next to permanently keeping a cash allocation you never intended to hold. The expensive error is not picking the wrong one of these two strategies. It is deferring the decision until the money has sat in cash for years — which is how most over-allocation to cash actually happens, through indecision rather than through choice. Both strategies beat that outcome: phasing in over three months beat staying in cash 69% of the time, and investing at once beat it 70% of the time.
Choosing the method you will stick to beats choosing the method with the better average. Choosing either beats choosing neither.
Frequently asked questions
Is it better to invest a lump sum or spread it out?
On expected return, a lump sum. Vanguard found that investing immediately beat a three-month phase-in 68% of the time for global equities over rolling one-year periods, producing median wealth 1.2% to 2.2% higher depending on the stock-bond mix. On the worst outcomes — below roughly the 25th percentile — phasing in did better. The right answer depends on whether an early loss would make you abandon the plan.
What did Vanguard’s lump sum vs dollar cost averaging study find?
That investing a lump sum immediately usually beats phasing it in, by a small margin. The 2012 paper by Shtekhman, Tasopoulos and Wimmer found the lump sum ahead in about two-thirds of rolling ten-year periods in the US, UK and Australia against a 12-month phase-in. The 2023 update by Finlay and Zorn found it ahead in 68% of rolling one-year periods for global equities against a three-month phase-in, with median wealth 1.2% to 2.2% higher. Phasing in did better only in the worst outcomes, and still beat holding cash 69% of the time.
What did Charles Schwab’s lump sum vs dollar cost averaging study find?
Schwab’s “Does Market Timing Work?” follows five hypothetical investors putting $2,000 a year into the S&P 500 over 2005–2024. Investing on the first trading day of each year ended with $170,555, splitting it into monthly instalments with $166,591, perfect timing with $186,077, and staying in Treasury bills with $47,357. Across 80 rolling 20-year periods since 1926, investing immediately never came last.
Why does investing immediately usually win?
Because cash underperforms. Between 1976 and 2022, US stocks beat three-month Treasury bills 76% of the time and bonds beat them 68% of the time, so money held back to be invested later typically forgoes that risk premium. Phasing in wins in the minority of periods that begin with a decline.
Is dollar-cost averaging a bad strategy?
No — it is a strategy with a measurable cost and a measurable benefit. It gives up roughly $500 of expected return on $100,000 over a three-month schedule in exchange for better outcomes in the worst scenarios and less exposure to regret. That is a reasonable trade for a loss-averse investor and an unnecessary one for someone who can sit through a fall without selling.
Does investing monthly from my salary count as dollar-cost averaging?
Not in the sense the research measures. Each contribution is invested as soon as it exists, so no money is being held back and no expected return is forgone. Vanguard draws the same distinction: their analysis concerns what to do with a lump sum that is already available. The comparison applies only when you hold the full sum in cash.
How long should I spread a lump sum over?
Shorter than most people assume. The opportunity cost rises with the length of the schedule, and Vanguard’s figures show it directly: in the US, immediate investment beat a three-month split 66.4% of the time and a six-month split 73.7% of the time. If you want the insurance, a quarter is a more defensible window than a year.
Does it matter how much interest my cash earns while it waits?
Yes. Crediting the uninvested money at the three-month Treasury bill rate, immediate investment won 65% of the time rather than 68% for an all-equity portfolio. The advantage narrows as cash rates rise, because the opportunity cost of waiting is precisely the spread between cash and the assets you intend to hold.
How loss-averse do I have to be for phasing in to make sense?
More than moderately. In Vanguard’s utility model, an adventurous investor preferred investing immediately whether or not losses were penalised, and a very conservative investor preferred phasing in either way. Only the moderately conservative profile switched — from immediate investment to phasing in — once a loss-aversion penalty of 2.5 times was applied.
Does this apply to my annual pension contribution?
Yes, in the same direction. Making the year’s contribution as early as possible is the lump-sum strategy applied to a recurring decision: you give up a little cash interest and gain months of market exposure. Repeated annually, the difference compounds.
What if the market crashes right after I invest everything?
That is the scenario phasing in is designed to soften, and it is what drives the roughly one-third of periods in which phasing in came out ahead — though most of those involved ordinary declines rather than crashes. It is worth thinking through beforehand: if a 30% fall in month two would make you sell, the problem is the allocation and the position size, not the timing method.
Sources
- Finlay, M. and Zorn, J. (2023). Cost averaging: Invest now or temporarily hold your cash? Vanguard Research, February 2023 (ISGCALS 022023). Hit ratios, wealth percentiles and simulation figures cited above are drawn from Figures 2, 3, 4 and 6 of this paper. Historical data cover the MSCI World Index 1976–2022 for global returns, with shorter windows for individual markets (US Russell 3000 from 1979; UK FTSE All-Share from 1986; Canada from 1985; Australia from 1992; emerging markets from 1988; Europe from 1998).
- Shtekhman, A., Tasopoulos, C. and Wimmer, B. (2012). Dollar-cost averaging just means taking risk later. Vanguard research, July 2012 (ICRDCA 072012). Figures 1–4 and the methodology on page 7; US data 1926–2011, UK 1976–2011, Australia 1984–2011. The link is the Internet Archive copy of Vanguard’s original PDF, whose address no longer resolves.
- Berkowitz, D. B. and Clarke, A. S. (2016). Invest now or temporarily hold your cash? Vanguard Financial Planning Perspectives, October 2016 (ISGDCA 102016). Figure 1; archived copy of Vanguard’s original PDF.
- Schwab Center for Financial Research. Does Market Timing Work? Charles Schwab, edition dated 18 July 2025, covering 2005–2024 and all rolling 20-year periods from 1926. Checked 25 September 2026.
- The finding is not new. Constantinides (1979) showed cost averaging to be suboptimal as an investment policy, and Rozeff (1994) and Brennan, Li and Torous (2005) reached compatible conclusions.
- On the behavioural side, Statman (1995) sets out the framework for why investors choose cost averaging anyway, and the loss-aversion penalty used in the utility model above follows Tversky and Kahneman (1992).
Once the money is in, the same contributions become the cheapest way to hold the allocation steady: rebalancing with new money avoids selling, and therefore avoids the tax.
Related reading
- How to manage investment risk — the hierarchy that puts timing last, and why.
- Position sizing and the risk of ruin — the decision that outranks when you invest.
- Portfolio construction in 2026 — deciding what the money buys before deciding when.
- Behavioural finance — why the plan you keep beats the plan with the better average.
- What type of investor are you? — the horizon and risk tolerance this decision depends on.
- Why savings lose value — the cost of the cash that never gets invested at all.
This article is general information, not personalised investment advice. It does not take into account the financial situation, objectives or risk tolerance of any individual reader, and the same text is distributed to all readers. Figures are drawn from the Vanguard research cited above and describe specific historical periods and simulated scenarios; they do not predict future outcomes. Capital is at risk and past performance does not indicate future results.