Best Green and Sustainable ETFs in 2026: ESG Funds, Clean Energy and Mutual Funds Compared
Key takeaway
Broad ESG ETFs have finished within 0.63 points a year of the unscreened market; clean energy ETFs fell 67% to 89% from their 2021 peaks. ESGU, ESGV, ICLN, TAN and eleven more funds compared on cost, holdings and measured returns to 3 November 2026.
“Green fund” covers two products that behave nothing alike. A broad ESG fund such as ESGU or ESGV holds a screened version of the whole stock market, and over eight to twenty years the large ones have finished within 0.63 percentage points a year of the unscreened index they started from. A clean energy fund such as ICLN or TAN holds a few dozen companies in one industry, and those funds fell between 67% and 89% from their early-2021 peaks to April 2025. Buying the second while expecting the first is the most expensive mistake in this category.
This guide compares fifteen sustainable, ESG, low-carbon, clean energy and green bond funds on what can be measured: cost, size, what they hold, and how they have returned against a conventional fund over the same dates. All figures are to the close of 3 November 2026 unless stated. It ranks nothing, because the right fund depends on which of the two products you are actually trying to buy.
Sustainable and green ETFs in 2026, compared
Five-year returns are annualised total returns, dividends reinvested. “Top 10” is the share of the fund in its ten largest holdings, a quick measure of concentration. The two conventional funds at the bottom are the yardstick.
| Fund | Type | Expense ratio | Assets | Top 10 | 5-yr return, a year |
|---|---|---|---|---|---|
| ESGU — iShares ESG Aware MSCI USA | Broad US, ESG-tilted | 0.15% | $17.8bn | 37.9% | 10.52% |
| ESGV — Vanguard ESG U.S. Stock | Broad US, exclusions | 0.09% | $13.4bn | 42.6% | 10.04% |
| DSI — iShares ESG MSCI KLD 400 | US, ESG leaders | 0.25% | $5.3bn | 46.1% | 10.40% |
| SUSA — iShares ESG Optimized MSCI USA | US, weighted by ESG score | 0.25% | $4.0bn | 32.8% | 9.56% |
| USSG — Xtrackers MSCI USA Selection Equity | US, ESG leaders | 0.09% | $0.6bn | 49.4% | 11.34% |
| ESGD — iShares ESG Aware MSCI EAFE | Developed ex-US | 0.20% | $11.9bn | 14.1% | 7.74% |
| ESGE — iShares ESG Aware MSCI EM | Emerging markets | 0.25% | $6.9bn | 39.6% | 6.03% |
| VSGX — Vanguard ESG International Stock | All ex-US | 0.10% | $6.7bn | 17.7% | 7.09% |
| CRBN — iShares Low Carbon Optimized MSCI ACWI | Global, low carbon | 0.20% | $1.2bn | 25.6% | 9.63% |
| ICLN — iShares Global Clean Energy | Clean energy, global | 0.38% | $2.0bn | 51.2% | −6.98% |
| TAN — Invesco Solar | Solar only | 0.70% | $0.9bn | 59.8% | −14.81% |
| QCLN — First Trust Nasdaq Clean Edge Green Energy | Clean energy plus EVs and chips | 0.59% | $0.55bn | 60.3% | −10.42% |
| PBW — Invesco WilderHill Clean Energy | Clean energy, small caps, evenly spread | 0.63% | $0.34bn | 16.6% | −20.27% |
| BGRN — iShares USD Green Bond | Green bonds | 0.20% | $0.5bn | — | 0.14% |
| VTI — Vanguard Total Stock Market | Conventional, US | 0.03% | $2.3trn | 34.7% | 10.59% |
| IVV — iShares Core S&P 500 | Conventional, US large cap | 0.03% | $881bn | 39.0% | 11.73% |
Two things stand out before any detail. The screened US funds sit in a narrow band around the market’s 10.59%; the clean energy funds lost money over the same five years, by between 7% and 20% a year. And several “ESG leaders” funds are more concentrated than the market, not less: USSG and DSI hold about 15% in Nvidia and 10% in Microsoft, against 7% and 5% in VTI, because excluding other companies leaves more weight for the ones that pass.
Three of these funds have changed their names since 2025: SUSA was the “iShares MSCI USA ESG Select” ETF until June 2025, DSI was the “iShares MSCI KLD 400 Social” ETF, and USSG was the “Xtrackers MSCI USA ESG Leaders Equity” ETF. A new name is not a new portfolio, which is the first hint about how much a label tells you.
The largest ESG ETFs by assets
By assets, the largest ESG equity ETF is ESGU, at $17.8bn across 268 holdings, followed by ESGV at $13.4bn across 1,209 stocks and ESGD at $11.9bn. Among clean energy ETFs, ICLN is the largest at $2.0bn, with 102 holdings. These are small numbers next to conventional index funds: VTI alone is about 170 times the size of ESGV.
Size matters for two practical reasons. A larger fund usually trades with narrower bid-ask spreads, which is a cost you pay every time you buy or sell. And small thematic funds close more often than large ones, which forces a sale at a time you did not choose and, in a taxable account, can trigger a capital gain.
What an ESG screen actually removes
Vanguard publishes exactly what its ESG index takes out of the market, which makes ESGV the clearest example. Its FTSE index starts from the whole US market and excludes companies involved in adult entertainment, alcohol, tobacco, cannabis, gambling, controversial and conventional weapons, civilian firearms, nuclear power, and coal, oil or gas, plus companies that fail certain labour, human rights, environmental, anti-corruption and diversity standards. As of 30 September 2026, FTSE Russell reported:
| Exclusion | Companies removed | Weight removed from the parent index | Largest names excluded |
|---|---|---|---|
| Non-renewable energy | 220 | 11.83% | Berkshire Hathaway, ExxonMobil, Chevron, Caterpillar, GE Vernova |
| Weapons | 91 | 5.21% | Walmart, Palantir, General Electric, RTX, Amphenol |
| Controversies | 16 | 3.00% | Johnson & Johnson, Walmart, Chevron, RTX, Wells Fargo |
| Diversity | 18 | 1.57% | Berkshire Hathaway, Astera Labs, Revolution Medicines, CoreWeave |
| Vice products | 37 | 1.04% | Philip Morris, Altria, VICI Properties, Casey’s General Stores |
A company can be excluded under several headings, so the rows do not add up. Walmart is out because it sells firearms; Caterpillar and GE Vernova fall under the non-renewable energy screen. Whether those exclusions match your own values is a question only the methodology answers, which is why reading it matters more than reading the fund’s name.
What remains still looks like the market. ESGV’s ten largest holdings are the same ten companies as VTI’s — Nvidia, Apple, Microsoft, Amazon, both Alphabet share classes, Broadcom, Meta, Micron and Tesla — at 42.6% of the fund against 34.7%. The difference is in the sector mix: technology is 44.4% of ESGV against 38.1% of VTI, and energy, 3.6% of VTI, is below 3% of ESGV.
The screen does lower the measured footprint. Vanguard, using MSCI data, puts ESGV’s carbon footprint at 8.6 tonnes of CO2-equivalent per $1m invested, against 22.6 for its parent index, and its weighted average carbon intensity at 39.0 tonnes per $1m of revenue, against 86.9. That is a statement about which companies you own, not about emissions removed from the world: someone else owns the excluded shares.
Not every broad ESG fund works this way. ESGU keeps sector weights close to the MSCI USA index and tilts towards higher-rated companies within each sector, so it still holds energy companies (3.6% of the fund). SUSA weights holdings by ESG score; DSI and USSG keep only the companies rated best within each sector. Four funds, four rules, and four different portfolios behind similar labels.
Do ESG ETFs underperform? The record against the parent index
The fair test is a screened fund against the conventional fund it was carved from, over the same dates. From each pair’s first common close to 3 November 2026:
| ESG fund | Compared with | Since | ESG fund, a year | Conventional, a year | Gap | Tracking error |
|---|---|---|---|---|---|---|
| ESGV | VTI | Sep 2018 | 13.95% | 13.44% | +0.51 pp | 2.3% |
| ESGU | IVV | Dec 2016 | 14.80% | 15.04% | −0.24 pp | 3.6% |
| USSG | IVV | Mar 2019 | 16.21% | 15.90% | +0.32 pp | 3.4% |
| SUSA | IVV | Jan 2006 | 10.34% | 10.96% | −0.63 pp | 4.7% |
| DSI | IVV | Nov 2006 | 10.54% | 10.82% | −0.28 pp | 7.2% |
| VSGX | VXUS | Sep 2018 | 8.06% | 8.31% | −0.25 pp | 2.5% |
| ESGD | EFA | Aug 2016 | 8.80% | 8.78% | +0.03 pp | 2.6% |
| ESGE | EEM | Jul 2016 | 8.21% | 7.59% | +0.61 pp | 4.5% |
| CRBN | ACWI | Dec 2014 | 10.70% | 10.68% | +0.03 pp | 4.1% |
| BGRN | AGG | Nov 2018 | 1.92% | 1.80% | +0.12 pp | 3.2% |
Six funds ahead, four behind, none by more than 0.63 points a year. Over these periods there is no evidence of a systematic cost to screening, and no evidence of a systematic reward either. Tracking error — the annualised volatility of the daily return gap — shows how far a fund can drift from its parent in any given year: about 2–4% for most, 7% for DSI, whose 402 holdings are a much smaller slice of the market.
The gaps that do appear come from sector weights, not from virtue. In 2022, when the Energy Select Sector fund (XLE) returned 64.3%, ESGV lost 24.0% against VTI’s 19.5%: 4.5 points of underperformance in one year, almost all from owning no oil and gas companies. In 2026 to 3 November XLE is up 52.1%, and ESGV again trails VTI, 10.4% against 11.7%. In 2019, 2020 and 2023, when technology led, ESGV came out ahead. An exclusion-based ESG fund is, in practice, an overweight in technology and an underweight in energy, and its relative return is mostly the relative return of those two sectors.
Clean energy ETFs: what the theme has actually returned
Clean energy funds own the businesses of the energy transition itself: solar and wind equipment makers, renewable utilities, fuel cells, grid hardware, and, in QCLN’s case, electric vehicles and power semiconductors. The theme can be sound and the funds still painful to hold, because the price paid for the theme moves far more than the businesses do.
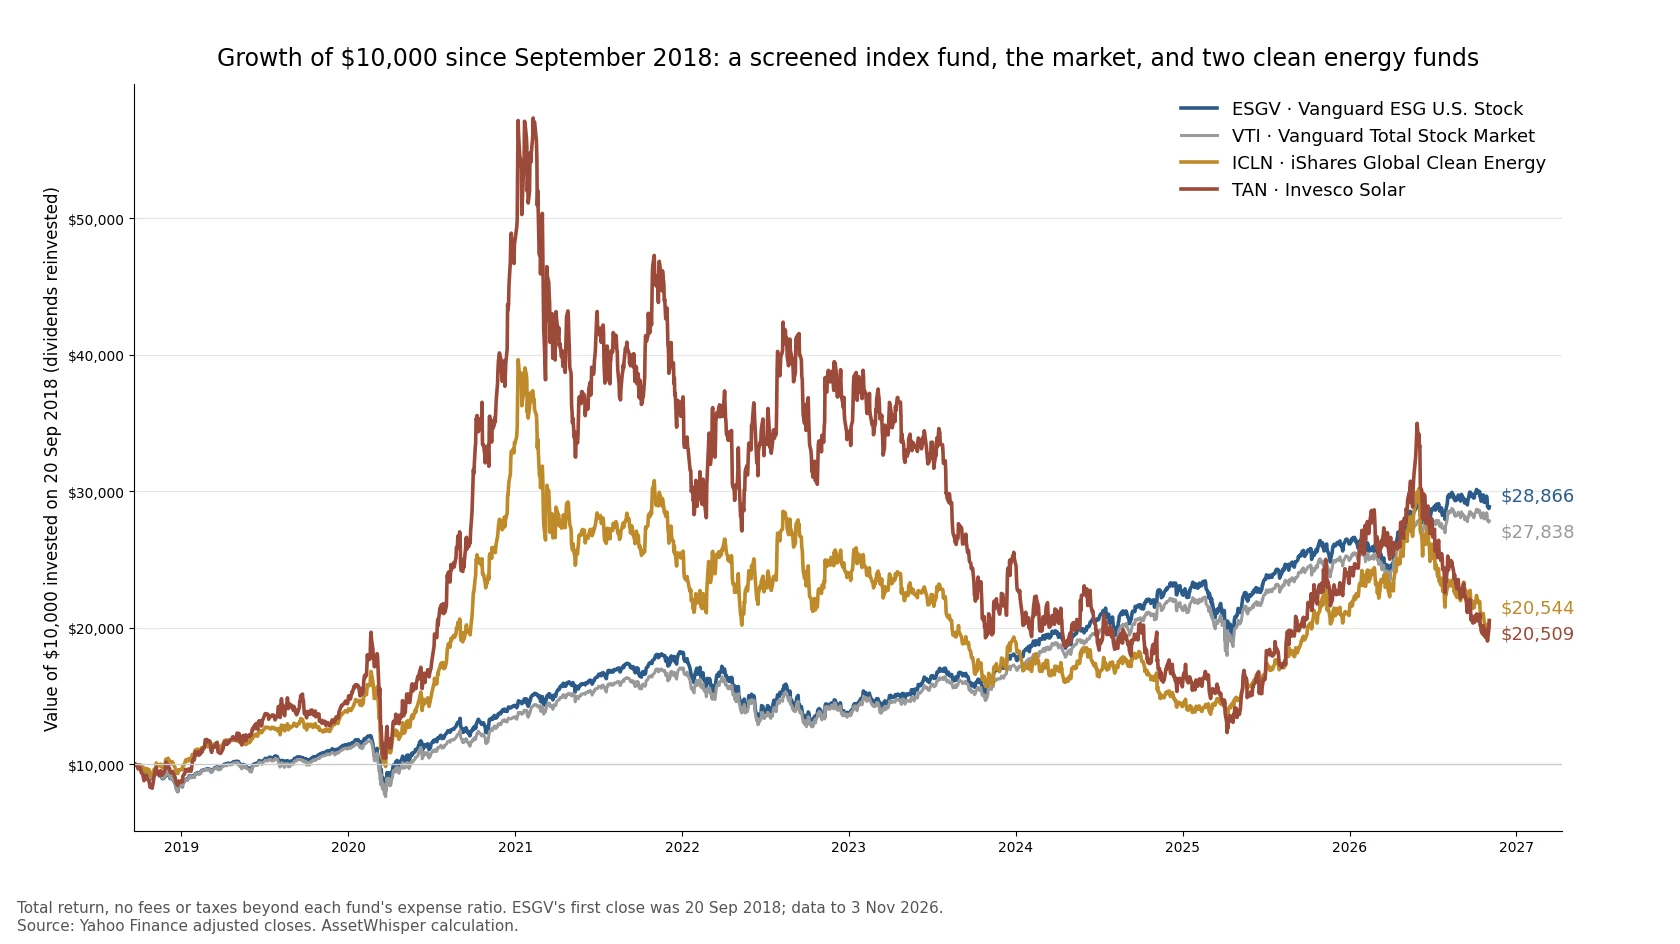
The chart is the whole story in one picture. Money put into ICLN or TAN in September 2018 was worth roughly four and six times the starting sum at the 2021 peak, after returns of 141.8% and 234.0% in 2020 alone. Then the funds fell for four years, and the same $10,000 is now worth about $20,500 in each — less than the $27,838 it would have become in the total market fund, with far more stress on the way.
| Fund | 2021 peak | Fall to 8 April 2025 low | Rise since that low | Still below the peak | Since launch, a year | Market over the same years |
|---|---|---|---|---|---|---|
| ICLN | 7 Jan 2021 | −66.7% | +55.8% | −48.2% | −4.39% (2008) | +8.37% (ACWI) |
| QCLN | 9 Feb 2021 | −71.7% | +86.2% | −47.3% | +4.78% (2007) | +10.73% (IVV) |
| TAN | 9 Feb 2021 | −78.5% | +66.5% | −64.2% | −7.70% (2008) | +8.25% (ACWI) |
| PBW | 9 Feb 2021 | −89.1% | +100.9% | −78.0% | −3.78% (2006) | +10.96% (IVV) |
Three of the four have lost money a year since launch, across roughly two decades in which global stocks returned about 8% a year. Over the last five years their annualised volatility ran from 28% (ICLN) to 44% (PBW), against 17.5% for the total US market. At that level of volatility a fund needs very large gains just to stand still — a fall of 78.5% needs a rise of 365% to get back to even — which is the arithmetic of volatility drag at its harshest. The 2025 rebound (47.0% for ICLN, 48.3% for TAN, 54.0% for PBW) shows the same mechanics working upwards.
Interest rates: a real link, but a loose one
Renewable projects are capital-intensive, financed with debt, and sell their output on long contracts, so a higher discount rate works against them twice. The data show the link but not a tight one. Across 167 months from 2013, in a month when the 10-year Treasury yield rose by a full percentage point, ICLN trailed global stocks by about 5.1% and TAN by about 6.4%; broad ESG funds showed no measurable sensitivity. But the correlation is only −0.20 for ICLN, which means rate moves explain about 4% of its monthly gap to the market. Policy, subsidies, trade tariffs and the earnings of a handful of large holdings explain the rest.
The timing is a warning against tidy stories. During 2022, when the 10-year yield rose from 1.51% to 3.88%, ICLN lost only 5.4% while the market fell 18–20%. The heavy losses came in 2023 (−20.4%) and 2024 (−25.7%), although the 10-year yield ended 2023 almost exactly where it had started it, at 3.87%. Whatever drove those two years, it was not mainly the bond market. We cover the general mechanism in how interest rates move each asset class.
Concentration inside the clean energy funds
ICLN holds 102 companies, but 51.2% of the fund is in its ten largest, led by Bloom Energy at 9.7% and China Yangtze Power at 8.1%; utilities are 40.8% of the fund. QCLN puts 60.3% in its top ten, including Tesla (7.8%) and Rivian (6.8%), which makes it partly an electric-vehicle fund. TAN, the solar fund, has 59.8% in ten companies. PBW is the exception, spreading its holdings so evenly that the top ten are 16.6%, which trades single-company risk for heavier exposure to small, often unprofitable firms — and PBW has had the deepest losses of the four.
The labels hide some surprises. Bloom Energy, ICLN’s largest holding, makes fuel cells that mostly run on natural gas, while GE Vernova, which makes wind turbines and grid equipment as well as gas turbines, is excluded from ESGV as a non-renewable energy company. Two products sold as “green” disagree on the same business, which is why the holdings list is the only reliable check.
How large a position like this should be matters more than which fund you pick; we work through the arithmetic in position sizing and the risk of ruin, and what concentration does to a portfolio in how much risk diversification removes.
Green and sustainable mutual funds
Mutual funds cover much of the same ground. They price once a day rather than trading continuously, some are actively managed, and some carry sales charges in their retail share classes. Four of the largest US sustainable mutual funds, with assets across all share classes:
| Fund | Approach | Expense ratio | Assets | 5-yr return, a year |
|---|---|---|---|---|
| VFTAX — Vanguard FTSE Social Index Admiral | Index, exclusions | 0.11% | $29.5bn | 10.61% |
| PRBLX — Parnassus Core Equity Investor | Active | 0.81% | $21.5bn | 8.93% |
| CISIX — Calvert US Large-Cap Core Responsible Index I | Index, ESG selection | 0.24% | $6.5bn | 10.12% |
| TICRX — Nuveen Large Cap Responsible Equity A | ESG selection | 0.49% | $5.8bn | 9.04% |
| VTI — Vanguard Total Stock Market ETF | Conventional | 0.03% | $2.3trn | 10.59% |
Returns for TICRX exclude its front-end sales charge, so an investor paying the charge earned less. The pattern is the familiar one: the two cheapest index funds sit next to the market, and the higher-cost funds trail it. That is what our review of index funds against active management finds across every category, and sustainable funds are not an exception. A mutual fund is mainly worth considering when it is the only sustainable option inside a workplace plan.
Green bond funds
Green bonds finance specific environmental projects, but their price depends on the same interest rates and credit quality as any other bond. BGRN, iShares’ US dollar green bond ETF with $0.5bn in assets, returned 1.92% a year since November 2018 against 1.80% for the broad US bond fund AGG, with a daily correlation of 0.84. It behaves like a bond fund with a green label on what it finances, not like an environmental equity fund, and it fell 19.2% from its peak to October 2022 as rates rose, almost exactly as much as AGG.
What cost does over twenty years
The gap between the cheapest and dearest funds in this guide looks small and is not. On $10,000 growing at 7% a year before fees for twenty years:
| Expense ratio | Example | Value after 20 years |
|---|---|---|
| 0.09% | ESGV, USSG | $38,051 |
| 0.15% | ESGU | $37,626 |
| 0.25% | SUSA, DSI, ESGE | $36,928 |
| 0.38% | ICLN | $36,039 |
| 0.59% | QCLN | $34,646 |
| 0.81% | PRBLX | $33,241 |
Between 0.09% and 0.81% the difference is $4,810, almost half of the original investment, for the same gross return. Higher costs pay for something only when the fund gives you an exposure you cannot get more cheaply; compounding works on fees exactly as it works on returns.
How to check a green fund before buying
- Decide which product you want. A screened version of the market (ESGU, ESGV, VSGX, CRBN) or a bet on the energy transition (ICLN, QCLN, TAN, PBW). The first replaces an index fund; the second is a satellite position that can fall by two thirds.
- Read the top ten holdings and the exclusion list. If the names surprise you, the screen is not what you assumed. The methodology document, not the fund name, says what is removed and at what revenue thresholds.
- Compare it with its parent index. For a broad ESG fund, look at the return gap and tracking error against the conventional fund it was built from, as in the table above. A gap of several points a year means you own a different portfolio, not a cleaner version of the same one.
- Check the concentration. A top ten above 50% means a single company’s bad quarter moves the whole fund.
- Price the cost. Use the twenty-year table: each 0.1 point of expense ratio is roughly $700 on $10,000 over two decades at these returns.
- Check size and trading. Small funds close more often than large ones, and wider spreads add a cost on every trade.
Sustainable fund flows and the rules behind the labels
Money had been leaving US sustainable funds for three and a half years. In the second quarter of 2026 the trend turned: Morningstar counted about $3.0bn of net inflows, the first positive quarter after 14 consecutive quarters of outflows, with US sustainable fund assets at a record $398bn at the end of June. The split was telling — passive funds took in $6.5bn while active funds lost $3.6bn — the same move towards cheap index exposure seen in conventional funds.
The names are also under new rules. The SEC’s amended Names Rule requires a fund whose name suggests a focus, including terms such as “ESG” or “sustainable”, to invest at least 80% of its assets accordingly, with compliance dates in June 2026 for larger fund groups and December 2026 for smaller ones. The renamings above happened in this period. For an investor the practical effect is limited: a compliant name tells you the fund follows its own stated policy, not that the policy matches your definition of green.
Frequently asked questions
What are the best green investment funds?
There is no single answer, because “green” names two different products. For a screened version of the whole market, the largest and cheapest funds are ESGU ($17.8bn, 0.15%), ESGV ($13.4bn, 0.09%) and, for international stocks, ESGD and VSGX; they have stayed within about 0.6 points a year of their unscreened counterparts. For direct exposure to the energy transition, ICLN is the largest clean energy ETF ($2.0bn, 0.38%). Which is “best” depends on which of the two you are trying to buy and how much volatility you can hold.
What is the largest ESG ETF?
ESGU, the iShares ESG Aware MSCI USA ETF, with $17.8bn on 3 November 2026, ahead of Vanguard’s ESGV at $13.4bn. Among mutual funds, Vanguard’s FTSE Social Index Fund is larger, at about $29.5bn.
Do ESG ETFs underperform the market?
Not systematically. Of the ten screened funds compared here with their conventional counterparts, six finished ahead and four behind, and none by more than 0.63 points a year over periods of eight to twenty years. Differences in any single year can be larger — ESGV trailed the market by 4.5 points in 2022 — and come mostly from owning less energy and more technology.
Are clean energy ETFs a good investment?
Their record is a warning about price, not a verdict on the theme. ICLN, TAN and PBW have lost money a year since launch over roughly two decades, fell 67–89% from their 2021 peaks, and rose 47–54% in 2025. They behave like concentrated sector bets with volatility of 28–44% a year, and are usually held, if at all, as a small satellite position.
What is the difference between an ESG ETF and a green ETF?
An ESG ETF applies a screen or a rating tilt to a broad index and ends up holding most of the market, including the largest technology companies. A green or clean energy ETF selects companies whose business is renewable energy or related technology, and holds a small corner of the market. The first behaves like an index fund; the second like a sector fund.
How do I compare an ESG ETF with a themed green ETF for a retirement account?
Compare each with the conventional fund it would replace: the return gap and tracking error against its parent index, the share in its top ten holdings, the expense ratio and the exclusion list. A broad ESG fund with a tracking error of 2–4% can replace a core index holding; a clean energy fund with a 50–60% top ten and 30–40% volatility is a separate position and should be sized as one.
What is the minimum investment for a sustainable ETF?
One share, or less at brokers that offer fractional shares. ETFs have no fund-level minimum and can be bought through any brokerage account in minutes. Mutual funds often do: Vanguard’s Admiral shares, for example, require $3,000.
Are there green bond ETFs?
Yes, though they are small. BGRN, the iShares USD Green Bond ETF, holds about $0.5bn. It has returned almost the same as the broad US bond market since 2018, because green bonds carry the same interest-rate risk as other bonds.
What is greenwashing in ETFs?
Marketing a fund as environmentally responsible when its holdings do not support the claim. The defence is mechanical: read the top holdings and the exclusion criteria, and compare the fund with its parent index, rather than relying on its name.
Methodology
- Prices and returns: dividend-adjusted daily closes from Yahoo Finance, to 3 November 2026. Annualised returns are compound annual growth rates; five-year figures run from 3 November 2021. Pair comparisons start at the later of the two funds’ first closes.
- Volatility and tracking error: annualised standard deviation of daily returns (√252), over the last five years for volatility and over the full common period for tracking error.
- Drawdowns: clean energy peaks are the highest close between June 2020 and June 2021; the low is the lowest close after that peak.
- Rate sensitivity: ordinary least squares of each fund’s monthly return minus ACWI’s on the monthly change in the 10-year Treasury yield (Cboe ^TNX), January 2013 to October 2026.
- Fund facts: assets and expense ratios from the issuers’ pages for ESGU, ICLN and DSI (3 November 2026) and ESGV’s fact sheet (30 September 2026); others from Yahoo Finance on 3–4 November 2026. Top-ten weights and sector weights from Yahoo Finance fund data.
- Costs: $10,000 compounding at 7% minus the expense ratio for 20 years; no taxes or trading costs.
- The calculation script and its output are kept with the article and reproduce every figure here.
Sources
- Vanguard, Vanguard ESG U.S. Stock ETF fact sheet, data as of 30 September 2026: exclusions, FTSE Russell exclusion table, climate metrics (MSCI data), holdings and assets.
- iShares, ESG Aware MSCI USA ETF (ESGU), Global Clean Energy ETF (ICLN) and ESG MSCI KLD 400 ETF (DSI) product pages, retrieved 4 November 2026.
- iShares Trust, summary prospectus for SUSA (form 497K), 2025: index and June 2025 name change.
- ESG Today, “U.S. sustainable fund flows turn positive for first time since 2022: Morningstar”, 3 August 2026, reporting Morningstar’s Q2 2026 US sustainable fund flows.
- ESG Dive, “SEC delays back Names Rule compliance dates”.
- Prices and fund data: Yahoo Finance, retrieved 4 November 2026.
Related reading
- Index funds vs active management — why cost decides most fund comparisons, sustainable ones included.
- Volatility drag — why a fund that rises 234% and falls 78% ends up behind.
- Position sizing and the risk of ruin — how much of a portfolio a sector bet should represent.
- Artificial intelligence ETFs — the other thematic category where concentration risk is routinely underestimated.
- How often do index funds rebalance? — what an index fund actually trades, screened or not.
- The Sharpe ratio — comparing funds on risk-adjusted returns rather than headline performance.
This article is general information, not personalised investment advice. It does not take into account the financial situation, objectives or risk tolerance of any individual reader, and the same text is distributed to all readers. The author holds no position in any fund mentioned. Expense ratios and assets under management change: verify current figures with the issuer before investing. Capital is at risk and past performance does not indicate future results.