Compound Interest: How Much of the Final Sum Was Ever Yours
Key takeaway
Run $10,000 plus $500 a month at 7% for 40 years and the calculator shows $1.48 million. Only 17% of that — $250,000 — is money you actually put in. The other 83% is growth compounding on growth, and by the final decade it does nearly all the work.
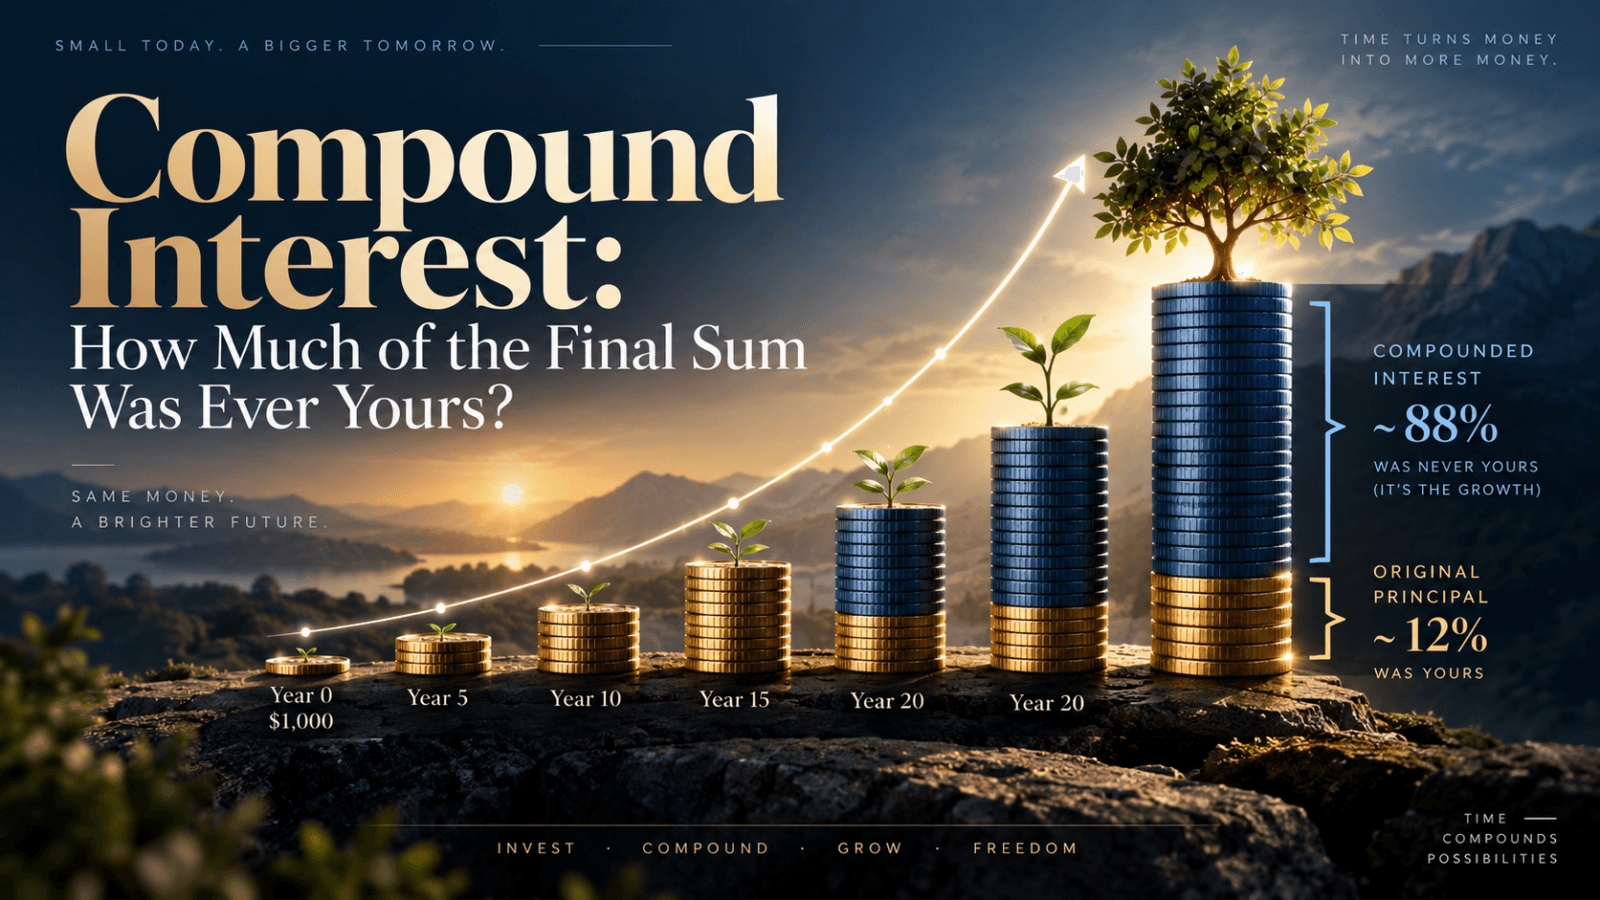
Every compound-interest chart makes the same visual argument: a nearly flat line for a decade or two, then a curve that bends upward and never looks back. What the chart does not say out loud is what fraction of that final number was ever money you handed over. Run a plausible, unremarkable investing life through the arithmetic — the further out you look, the smaller your own contribution becomes as a share of the total, and by the fourth decade it is a rounding error next to the growth.
This article runs that arithmetic using the exact formula behind our compound interest calculator, so every figure below can be reproduced, and changed, with your own numbers.
The scenario
Start with $10,000, add $500 a month, earn 7% a year compounded monthly — the calculator’s own defaults, chosen because they are unremarkable rather than optimistic. Run it for 10, 20, 30 and 40 years and split each result into what was contributed and what was growth on top of it.
| Year | Balance | You contributed | Growth | Share that was growth |
|---|---|---|---|---|
| 10 | $106,639 | $70,000 | $36,639 | 34% |
| 20 | $300,851 | $130,000 | $170,851 | 57% |
| 30 | $691,150 | $190,000 | $501,150 | 73% |
| 40 | $1,475,521 | $250,000 | $1,225,521 | 83% |
At year 10, two-thirds of the balance is still your own money — compounding has barely started to show. By year 40, five-sixths of it never came out of your pocket at all: $250,000 contributed over four decades produced a further $1,225,521 that you did nothing to earn beyond leaving it invested. The final sum is overwhelmingly the market’s contribution, not yours, and the crossover — the year growth overtakes contributions as the majority of the balance — happens in year 17 in this scenario.
The same fact, one decade at a time
The table above compares cumulative totals. Looking at what each individual decade adds to the balance is more striking, because it shows contributions becoming almost irrelevant to your own progress — not just to the total.
| Decade | Added to the balance | From new contributions | From growth |
|---|---|---|---|
| Years 1–10 | $96,639 | $60,000 (62%) | $36,639 (38%) |
| Years 11–20 | $194,212 | $60,000 (31%) | $134,212 (69%) |
| Years 21–30 | $390,300 | $60,000 (15%) | $330,300 (85%) |
| Years 31–40 | $784,370 | $60,000 (8%) | $724,370 (92%) |
You contribute exactly $60,000 in every decade — the monthly amount never changes in this scenario. What changes is how much that $60,000 matters. In the first decade it is 62% of that decade’s progress; in the last decade it is 8%. By the final ten years, the account is essentially compounding on its own and your monthly contribution, while still real money, is a rounding error against what the balance is already doing without you.
Why early money is worth more than late money
The decade breakdown implies something sharper: not just that later contributions matter less in proportion, but that the same dollar is worth more the earlier it goes in, because it has more compounding periods ahead of it. Isolate the effect by comparing two identical $60,000 blocks of contributions — one made in years 1–10 and then left untouched, one made in years 31–40 — inside the same 40-year, 7% scenario:
| Total contributed | Value at year 40 | |
|---|---|---|
| $500/month in years 1–10, then left to compound | $60,000 | $702,421 |
| $500/month in years 31–40 | $60,000 | $86,542 |
The identical $60,000, contributed at the identical monthly pace, is worth 8.1 times more at year 40 if it went in during the first decade rather than the last. Nothing about the amount changed — only how many years it had to compound. The practical consequence: “start early” is not really advice about total years invested, it is advice about which years those are, and the first ones are worth disproportionately more than the last ones.
What ten years of delay actually costs
Put a number on that consequence rather than leaving it as an abstraction. Compare someone who starts at 25 and invests for 40 years to someone who starts at 35 and invests for 30 — both retiring at 65, both contributing $10,000 to start and $500 a month at 7%:
| Years invested | Total contributed | Balance at 65 | |
|---|---|---|---|
| Starts at 25 | 40 | $250,000 | $1,475,521 |
| Starts at 35 | 30 | $190,000 | $691,150 |
Ten fewer years of contributing $500 a month means $60,000 less put in — but the balance at 65 is $784,370 lower, more than thirteen times the shortfall in contributions. The gap is almost entirely the compounding the later starter’s first decade never got to do. To close it from age 35 onward, the monthly contribution has to rise from $500 to $1,143 — more than double — just to reach the same $1,475,521 at 65. Ten years of delay is not a ten-year problem; catching up costs far more than the years themselves would suggest.
What changes the shape
Three inputs decide how fast the growth line pulls away from the contribution line, and they interact rather than add up:
- Time is the dominant lever. The 8.1× figure above came entirely from moving the same contributions earlier — the rate and the monthly amount never changed.
- The rate compounds the effect of time, it doesn’t substitute for it. Run the same 40-year scenario at 5% instead of 7% and the final balance falls from $1,475,521 to $836,594 — growth’s share of the total drops from 83% to 70%. A lower rate does not just produce a smaller number; it flattens the whole shape, so contributions stay a larger fraction of the total for longer.
- Contribution size scales the total but barely touches the shape. Doubling the monthly amount to $1,000 raises the 40-year balance by 89%, to $2,787,928 — not quite double, because the original $10,000 principal doesn’t grow with it — but the growth share barely moves, from 83% to 82%, because contributions and growth scale together.
Change any of these in the calculator and the future-value, total-contributed and interest-earned figures update live — it is the same formula used to build every table above, so a different starting amount, rate or horizon is one edit away rather than a re-derivation.
What this doesn’t say
None of this is a projection. A 7% annual return, delivered smoothly every year for 40 years, is a modelling convenience, not a forecast: real markets compound unevenly, with years of loss mixed into the average, and the arithmetic above assumes the rate holds and the contributions never stop. Uneven returns also compound at less than their average: the S&P 500 averaged 11.85% a year from 1928 to 2025 but compounded at 10.02%, the gap explained in volatility drag. What it does show correctly is the shape — that compounding is convex, that time matters more than any other single input, and that the fraction of a long-term balance which is “yours,” in the sense of money you actually handed over, shrinks every year you stay invested. That shape holds regardless of which specific rate turns out to be realistic.
The steady $500-a-month assumption is a simplification too. Real contributions get skipped in lean months and increased after a raise; real returns arrive as an uneven sequence rather than a constant 7%, and a downturn early in the 40 years does less damage than the same downturn late, precisely because of the asymmetry this article has been describing — money that has fewer years left to recover from a loss is money where the loss matters more. None of that changes the direction of any conclusion above. It changes the exact numbers, which is what the calculator is for: run your own contribution pattern and horizon rather than treating the figures here as anything more than the shape of the mechanism.
Frequently asked questions
How much of a compounded balance is actually your money?
It depends entirely on the time horizon, but the share shrinks the longer you stay invested. In a 40-year, 7%-a-year scenario with $10,000 to start and $500 a month, contributions make up only 17% of the final balance; the other 83% is growth.
Is it better to invest a fixed amount early or the same amount later?
Earlier, decisively. The same $60,000 contributed over ten years is worth 8.1 times more by year 40 if that ten-year window is the first decade rather than the last, purely because of how many years it had left to compound.
Does a higher return rate matter more than starting early?
Both matter, but they are not interchangeable. Raising the rate scales the final number up; starting earlier changes how many compounding periods each dollar gets, which is why the same contribution is worth more than eight times as much depending only on when it went in.
What is the “crossover point” in compound interest?
The point at which growth becomes a larger share of the balance than your own contributions. In the scenario above — $10,000 to start, $500 a month, 7% a year — that happens in year 17.
Does doubling my monthly contribution double my final balance?
Roughly, yes — contribution size scales the whole result fairly proportionally. What it does not do is change the shape of the growth-versus-contribution split at a given year, because both halves scale together.
Where do these numbers come from?
The same formula as our compound interest calculator: future value = principal × (1 + rate/compounds)^(compounds × years), plus the future value of the monthly contribution stream at the monthly rate. Every figure in this article can be reproduced there with the stated inputs.
This article is general information, not personalised investment advice. It does not take into account the financial situation, objectives or risk tolerance of any individual reader, and the same text is distributed to all readers. The 7% annual return used throughout is an illustrative assumption, not a projection or a guarantee — actual investment returns vary year to year and can be negative. Past performance does not indicate future results, and capital is at risk.
Sources
- All figures in this article are our own calculations, using the same compound-interest formula that powers the site’s investment calculator: FV = P·(1 + r/n)^(n·t) for the lump sum, plus an ordinary annuity future value for monthly contributions at the monthly rate. Reproducible by entering the stated inputs (principal $10,000, rate 7%, monthly compounding, $500/month) into the calculator.
Related reading
- Lump sum vs dollar-cost averaging — the related question of timing a given amount of money you already have, rather than contributing it gradually.
- Why your savings lose value every year — the mirror image of this article: what happens to money that isn’t invested at all.
- What type of investor are you? — the risk-profile quiz that sets the horizon this kind of projection should actually be run over.
- Position sizing and the risk of ruin — why a smooth compounding curve like the one here is a modelling convenience, and what a real, lumpy equity curve does to it.