Mean Reversion vs Trend Following: What the Evidence Says, and What Each One Costs
Key takeaway
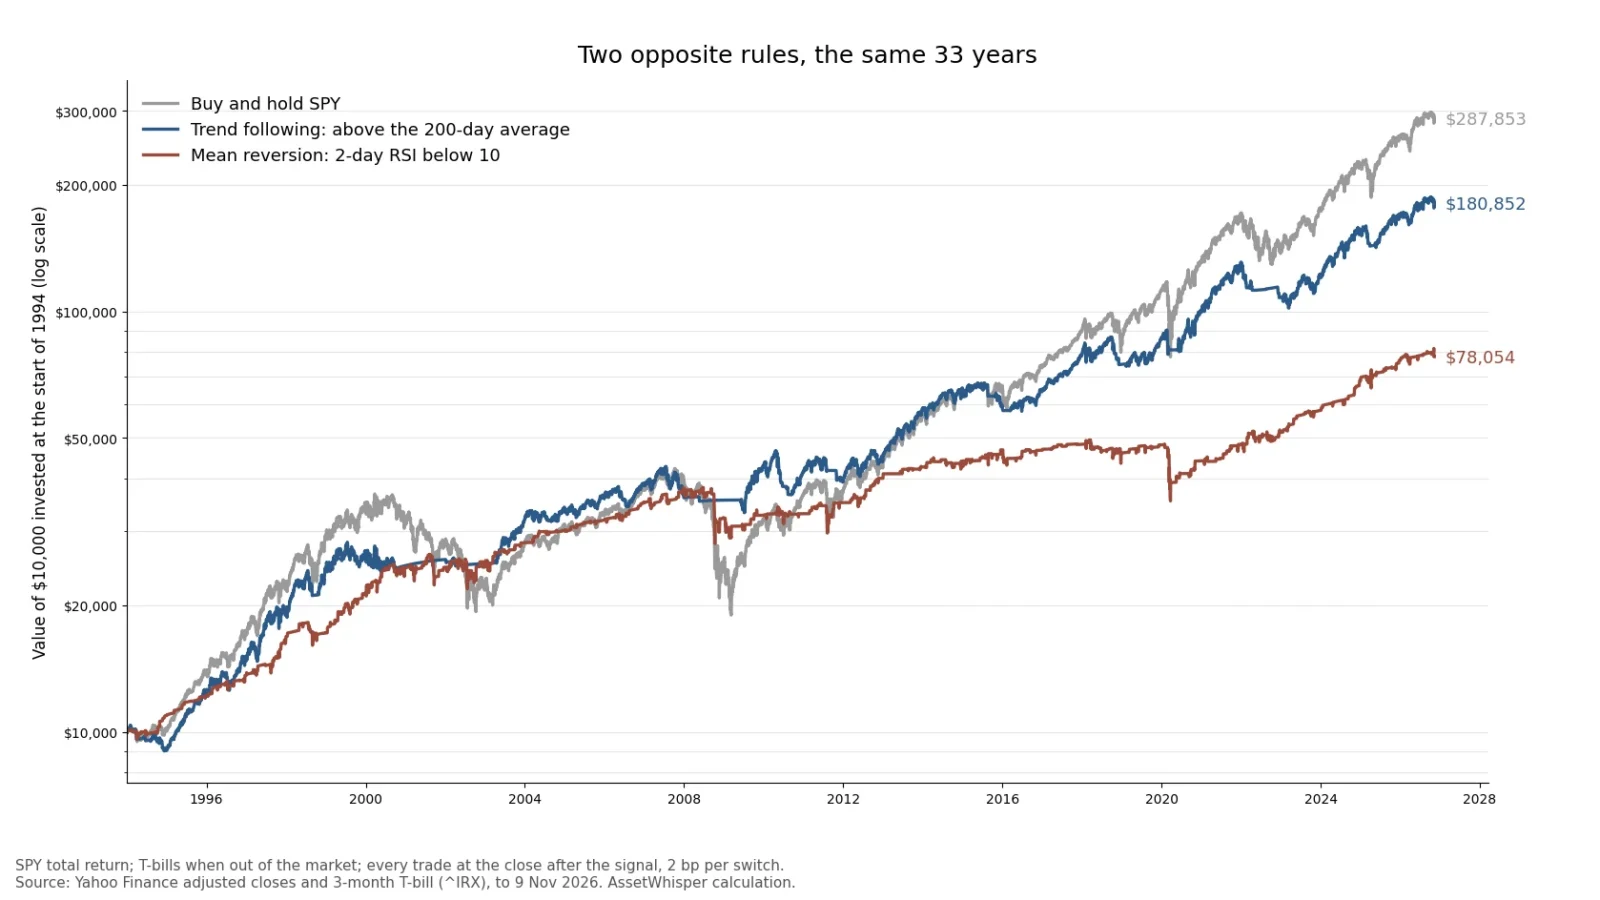
On SPY from 1994 to November 2026, neither a 200-day trend rule (9.4% a year) nor a 2-day RSI mean-reversion rule (7.0%) beat buy-and-hold (10.8%), and both roughly halved the worst fall. The trend rule won 44% of its trades and lagged in most years; the reversion rule won 69% and lost 25% in five weeks in 2020.
Trend following buys what has been rising. Mean reversion buys what has just fallen. They are opposite instructions, and both have decades of published evidence behind them. That is not a contradiction: the two effects live at different horizons, and they charge for themselves in opposite ways.
We ran the best-known rule of each kind on the same data, SPY from 1994 to 9 November 2026, with the same execution and the same cash rate:
- Neither beat holding the fund. Buy-and-hold returned 10.8% a year. Staying in while SPY was above its 200-day average returned 9.4%; buying when the 2-day RSI fell below 10 returned 7.0%. Both roughly halved the worst fall.
- They win in opposite shapes. The trend rule won 44% of its trades and its five best supplied 70% of the total. The reversion rule won 69% of its trades, and its worst loss (−13.9%) was almost twice its best gain (+7.7%).
- They pay in opposite currencies. The trend rule finished ahead of buy-and-hold in only 7 of 33 years. The reversion rule lost a quarter of its value in five weeks in 2020.
- Speed costs one of them far more. Buying one day later took 2.5 points a year off the reversion rule and nothing off the trend rule.
None of this is a forecast, and neither rule is a recommendation. They are two textbook examples, used to measure what each family asks of whoever runs it.
The short answer, in one table
| SPY, 1994 – 9 Nov 2026 | Buy and hold | Trend following (200-day average) | Mean reversion (2-day RSI below 10) |
|---|---|---|---|
| Return a year, no costs | 10.78% | 9.37% | 6.97% |
| Volatility | 18.7% | 12.2% | 10.7% |
| Sharpe ratio | 0.51 | 0.59 | 0.45 |
| Worst fall | −55.2% | −22.0% | −27.8% |
| Share of days in the market | 100% | 77.3% | 16.8% |
| Round trips a year | — | 3.3 | 11.8 |
| Trades won | — | 44.4% | 69.3% |
| Average win / average loss | — | +9.25% / −1.76% | +1.46% / −1.90% |
| Best trade / worst trade | — | +66.4% / −5.1% | +7.7% / −13.9% |
| Return a year at 10 bp a trade | 10.78% | 8.66% | 4.47% |
| Calendar years ahead of buy-and-hold (2 bp a trade) | — | 7 of 33 | 11 of 33 |
Both rules hold SPY or 3-month Treasury bills. Dividends are reinvested, cash earns the T-bill rate, and every trade is made at the close after the one that produced the signal, the standard we set out in how to read a backtest.
Two rules, defined before the test
- Trend following: hold SPY while its close is above its 200-day simple moving average; hold T-bills otherwise. This is the daily version of the 10-month rule popularised by Meb Faber in 2007, and far older than that.
- Mean reversion: buy SPY when its 2-day RSI closes below 10, which happens after two or three sharp down days; sell at the first close above the 5-day average. This is the core of the rule published by Larry Connors and Cesar Alvarez in 2009; their version also requires the price to be above its 200-day average, a condition we come back to below.
We did not search for these. They are the versions most often quoted, with their published parameters, and that matters: the reversion rule’s results before 2009 were already known to its authors when they chose it. A 2-day RSI rule was also the best of the 90 variants in our indicator test, which is what “best-known” usually means. Read the reversion numbers as a flattering case.
Where each effect lives: the horizon
The academic record does not say that markets trend or that they revert. It says both, at different horizons:
| Horizon | What tends to happen | Key evidence |
|---|---|---|
| Days to a month | Reversal: recent losers bounce, recent winners give some back | Jegadeesh (1990) and Lehmann (1990) on individual stocks; Nagel (2012) reads the profit as a payment for supplying liquidity |
| One month to a year | Continuation: what rose over the past year tends to keep rising | Moskowitz, Ooi and Pedersen (2012) on 58 futures markets; Hurst, Ooi and Pedersen (2017) back to 1880 |
| Three to five years | Reversal again, weaker and hard to trade | Poterba and Summers (1988) |
The two rules sit on different rows. A 200-day average is a one-year continuation rule; a 2-day RSI is a few-days reversal rule. Both rows show up in the S&P 500 itself, though not in every period.
The few-day reversal is recent. Until the 1990s, the index did the opposite: a down day was followed, on average, by another down day.
| S&P 500 index, daily | Correlation of one day’s return with the next | Average return the day after a fall | Average return the day after a rise |
|---|---|---|---|
| 1950–1969 | +0.12 | −0.08% | +0.14% |
| 1970–1989 | +0.13 | −0.09% | +0.14% |
| 1990–1999 | +0.02 | +0.02% | +0.10% |
| 2000–2009 | −0.09 | +0.11% | −0.10% |
| 2010–2019 | −0.05 | +0.05% | +0.04% |
| 2020–Nov 2026 | −0.17 | +0.12% | 0.00% |
A “buy the dip” rule tested on index data before 1990 would have bought, on average, into another fall; the same rule after 2000 looks like an edge. The sign of the effect changed, which is the first thing to know about any rule built on it.
The one-year continuation is small on average and large in the tail. Since 1951, the month after a positive trailing twelve months returned +0.82% on average (price only); the month after a negative twelve months returned +0.48%. The bigger difference is in the risk: monthly volatility was 5.2% after a negative year against 3.8% after a positive one, and 12 of the 20 worst months began with the trailing year already negative, although such months are only 25% of the total. That is what a trend rule actually buys: fewer of the worst months, not a higher average.
Result one: neither beat holding, both cut the fall
The trend rule was in the market 77% of the time and earned 9.37% a year against buy-and-hold’s 10.78%. Its Sharpe ratio was higher (0.59 against 0.51) because its volatility fell by more than its return, and its worst fall was 22.0% instead of 55.2%. A fixed mix of 77% SPY and 23% T-bills, the same average exposure with no timing, earned 9.18% with a worst fall of 45.0%. So the timing added about 0.2 points a year of return and removed half of the drawdown. This matches the 92-year record of the 10-month moving average: protection, paid for in return.
The reversion rule is a different animal. It held SPY on only 16.8% of days and still earned 6.97% a year. A fixed mix with that exposure earned 4.10%. On the days it was invested, SPY returned the equivalent of 32% a year, three times its average. The few days after a sharp fall really have been better than ordinary days in this sample.
But look at the worst fall: 27.8%, with a sixth of the market exposure. The days it holds are the most dangerous ones on the calendar, and that is where its cost is.
Result two: the shape of the trades
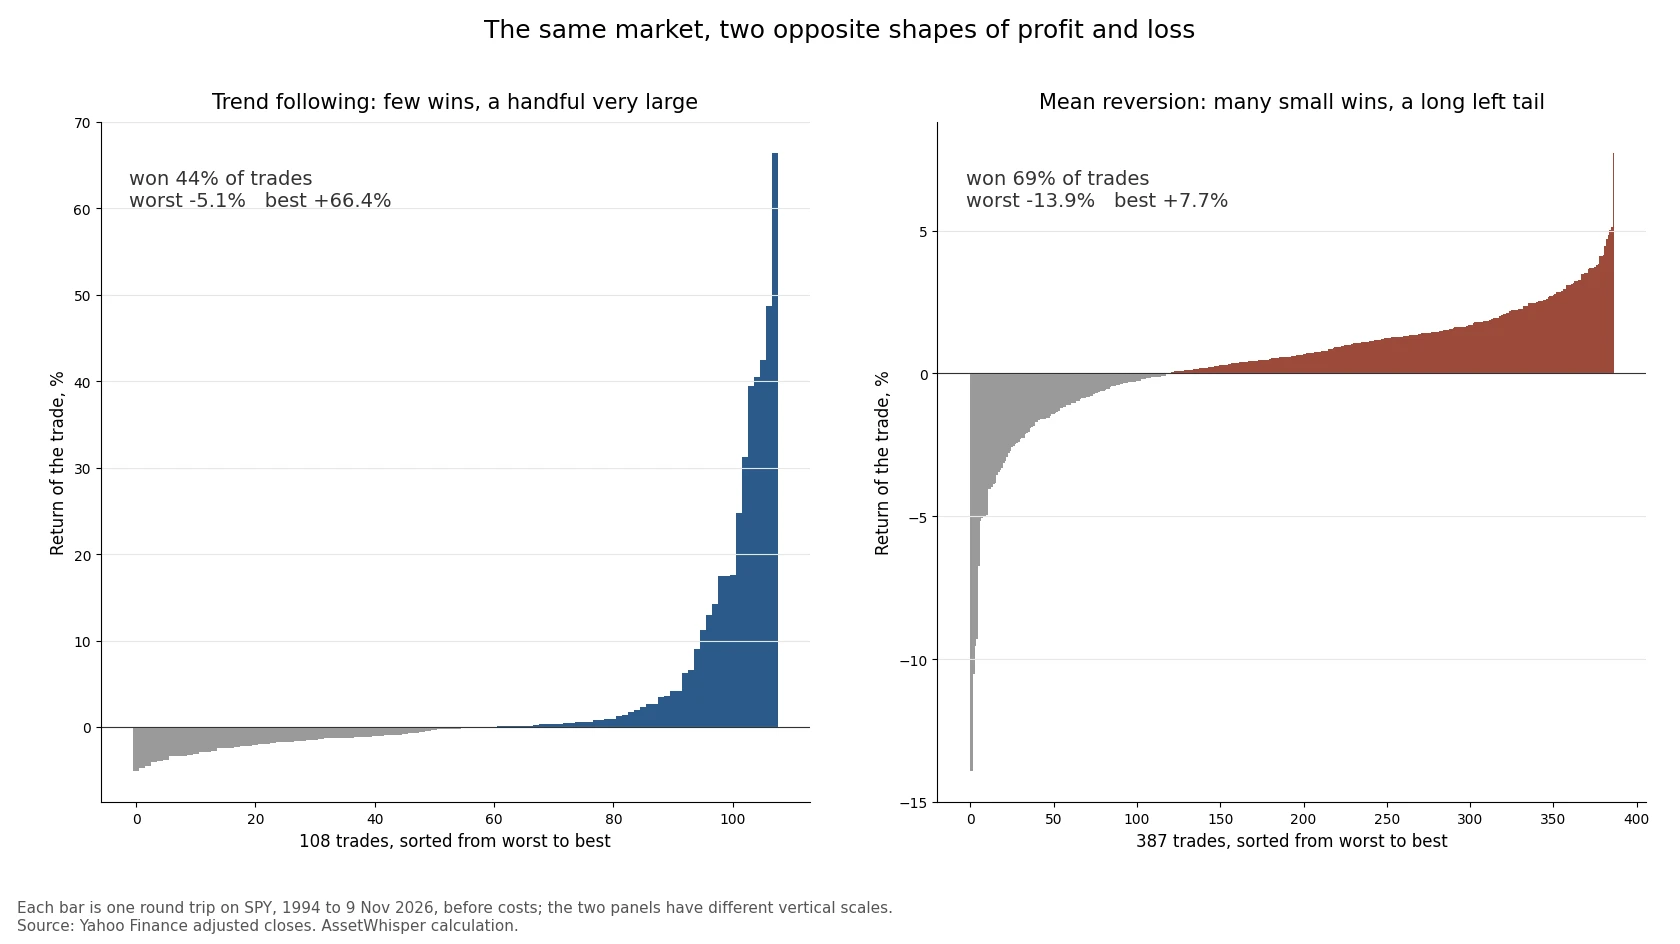
Trend following loses often and wins big. Of 108 trades, 60 lost money. The median trade was a loss of 0.2%, and half of all trades were over within five days: the price crossed above the average, fell back, and the rule sold. The average loss was 1.76% and the worst 5.1%. The profit came from a handful of long holds: the average win was 9.25%, the best was 66.4%, and the five best trades supplied 70% of the sum of all trade returns. Miss those five and little is left.
Mean reversion wins often and loses big. Of 387 trades, 69.3% made money, and the median trade gained 0.6% in three days. But the average loss (1.90%) was larger than the average win (1.46%), and the tail is on the wrong side: the best trade made 7.7% and the worst lost 13.9%. The three worst were March 2020 (−13.9% in 11 days), October 2008 (−13.9% in 10 days) and September 2001 (−10.5% in 12 days). The five worst trades took back 35% of everything the rule made.
The economics behind the two shapes are well described in the literature. A trend follower behaves like a buyer of insurance: a steady drip of small premiums (the whipsaws), and a large payout when a move keeps going. A short-term reversal trader behaves like a seller of it. Nagel (2012) shows that reversal profits look like the fee earned for taking the other side when others need to sell, and that the fee is highest when volatility is high, which is exactly when the buyer of the dip can be run over. A 69% win rate is not evidence of a better strategy. It is what selling insurance looks like between claims.
Result three: speed and costs
The two rules also differ in how exactly they have to be executed.
| Return a year, SPY 1994–2026 | 0 bp a trade | 2 bp | 5 bp | 10 bp |
|---|---|---|---|---|
| Trend, bought at the signal’s own close | 9.12% | 8.97% | 8.76% | 8.41% |
| Trend, bought at the next close | 9.37% | 9.22% | 9.01% | 8.66% |
| Reversion, bought at the signal’s own close | 9.44% | 8.92% | 8.16% | 6.89% |
| Reversion, bought at the next close | 6.97% | 6.46% | 5.71% | 4.47% |
One day’s delay cost the reversion rule 2.5 points a year, a quarter of its return. A bounce after a sharp fall is fast, and a good part of it happens on the first day. To earn the top line you must compute the signal on a closing price and trade at that same close, which is possible only approximately, in the last minutes of the session. The trend rule does not care: a day later was, if anything, slightly better, because a one-year signal does not go stale overnight.
Costs follow the turnover. The reversion rule switches 23.6 times a year and the trend rule 6.5. At 10 basis points a switch that is about 2.4 points a year for one and 0.7 for the other. On a fund as liquid as SPY the true cost is nearer the left of the table. On individual stocks, where the short-term reversal effect was first measured and is strongest, it is not: de Groot, Huij and Zhou (2012) find that trading costs consume the reversal profit across a broad universe of stocks, and that what survives is concentrated in the largest, most liquid names.
Result four: each one’s bad years
With 2 basis points a trade, the two halves of the sample look like this:
| 1994–2010 | 2011–Nov 2026 | |
|---|---|---|
| Buy and hold | 7.92% a year, Sharpe 0.31 | 13.94% a year, Sharpe 0.76 |
| Trend following | 8.71%, Sharpe 0.47 | 9.78%, Sharpe 0.72 |
| Mean reversion | 7.28%, Sharpe 0.39 | 5.59%, Sharpe 0.43 |
In the first half, which contained two falls of about 50%, both rules had a better Sharpe ratio than holding and the trend rule a better return. In the second half, a long bull market, neither did. Year by year, the trend rule finished ahead of buy-and-hold in 7 of 33 calendar years and the reversion rule in 11; in 15 years both were behind. The trend rule had more losing years than the fund itself (10 against 6), because of whipsaws in flat markets such as 1994, 2011 and 2015. That is the trend follower’s bill: long stretches of being a little wrong.
The four big falls show what each rule is and is not protection against:
| SPY peak to trough | Buy and hold | Trend following | Mean reversion |
|---|---|---|---|
| March 2000 – October 2002 (31 months) | −47.5% | −9.4% | +0.5% |
| October 2007 – March 2009 (17 months) | −55.2% | −14.1% | −19.0% |
| February – March 2020 (5 weeks) | −33.7% | −10.3% | −25.4% |
| January – October 2022 (9 months) | −24.5% | −13.1% | +1.8% |
The reversion rule got through the two slow bear markets, 2000–02 and 2022, without a loss: a decline made of falls and rallies gives it bounces to sell. It was hurt in the two fast ones, when a sharp fall was followed by a sharper one. In five weeks in 2020 it lost 25.4% while invested only part of the time. The trend rule was out of the market for most of all four, at the price of also being out for the start of each recovery: in the twelve months after the March 2009 low, SPY returned 71.9% and the trend rule 22.7%. Our article on bear markets has the depth and duration of each.
Does it hold on other assets?
One fund over one period is one sample. We ran the same two rules, with no change, on six other ETFs from 2006 to November 2026, with 2 basis points a trade.
| 2006 – Nov 2026 | Buy and hold: a year / Sharpe / worst fall | Trend following | Mean reversion |
|---|---|---|---|
| SPY (US large companies) | 11.0% / 0.55 / −55.2% | 8.1% / 0.58 / −22.4% | 4.4% / 0.29 / −28.4% |
| QQQ (Nasdaq-100) | 15.4% / 0.68 / −53.4% | 12.1% / 0.69 / −25.3% | 6.7% / 0.44 / −28.6% |
| IWM (US small companies) | 8.6% / 0.39 / −58.6% | 4.6% / 0.26 / −35.5% | 4.0% / 0.23 / −41.1% |
| EFA (developed markets ex-US) | 5.8% / 0.29 / −61.0% | 6.7% / 0.44 / −25.8% | 0.8% / −0.01 / −34.9% |
| EEM (emerging markets) | 5.7% / 0.28 / −66.4% | 4.9% / 0.27 / −35.6% | 4.0% / 0.22 / −36.2% |
| TLT (long Treasuries) | 2.7% / 0.14 / −48.4% | 2.3% / 0.11 / −39.4% | 2.4% / 0.14 / −22.4% |
| GLD (gold) | 10.1% / 0.52 / −45.6% | 7.4% / 0.44 / −34.4% | 2.5% / 0.14 / −34.9% |
The pattern from SPY repeats, and it is not flattering. The trend rule cut the worst fall on all seven funds, earned more than buy-and-hold on one (EFA) and had a higher Sharpe ratio on three. The reversion rule cut the worst fall on all seven, earned more than buy-and-hold on none, and matched its Sharpe ratio only on TLT; on EFA it earned less than T-bills. Its win rate was between 56% and 71% on every fund, including the ones where it made almost nothing. A high win rate travelled well. The profit did not.
Running both
Because they fail at different times, the two rules are only loosely related: the correlation of their monthly returns was +0.21. Half the money in each, rebalanced daily, returned 8.10% a year on SPY with a Sharpe ratio of 0.63 and a worst fall of 20.0%, a better ratio and a smaller fall than either alone, and 2.7 points a year less than buy-and-hold.
The trend state also changes what a dip is. Reversion trades opened while SPY was above its 200-day average won 70.9% of the time, averaged +0.54% and never lost more than 9.3%. Those opened below it won 65.6%, averaged +0.18%, were twice as volatile, and include all three of the worst trades. Buying a dip in a rising market and buying one in a falling market are different bets with the same name. That observation was made on the same data as everything else here, so treat it as a description, not a tested filter.
What the evidence supports, and what it does not
It supports:
- Both effects exist at their own horizons, in published studies across many markets and long histories, and in this sample.
- The useful question is not which is better but which cost you can bear. Trend following costs years of lagging and a majority of losing trades. Mean reversion costs rare, fast, large losses, and demands precise execution.
- Win rate describes the shape of a strategy, not its quality. 44% was the better rule here and 69% the worse one.
- Both rules reduced the worst fall on every fund tested.
It does not support:
- That either rule beats holding the fund. On return, neither did on SPY, and the 14 fund-and-rule combinations produced one win.
- That the few-day reversal is a permanent feature of markets. On the S&P 500 it had the opposite sign for forty years.
- That these exact parameters are special. They were chosen because they are famous, which usually means they looked best in the past. See the overfitting test in how to read a backtest.
- Any claim about taxes. Both rules realise short-term gains that a buy-and-hold investor defers, and the reversion rule does it a dozen times a year. Nothing here is after tax.
Where these two families sit among the others, with pairs trading and cross-sectional momentum, is in which algorithmic trading strategies are actually profitable. How large a position either shape of return can carry is a separate calculation: see position sizing and the risk of ruin.
Frequently asked questions
What is the difference between mean reversion and trend following?
Trend following holds an asset while its price is rising over months and leaves when it is falling. Mean reversion buys after a sharp short-term fall and sells on the bounce. On SPY from 1994 to November 2026, a 200-day moving-average trend rule traded 3.3 times a year and won 44% of its trades; a 2-day RSI reversion rule traded 11.8 times a year and won 69%.
Which is more profitable, mean reversion or trend following?
In this test neither beat buy-and-hold on return. SPY returned 10.8% a year, the trend rule 9.4% and the reversion rule 7.0% before costs. The trend rule had the best Sharpe ratio (0.59, against 0.51 for buy-and-hold and 0.45 for reversion). Across seven ETFs since 2006, the trend rule beat buy-and-hold on return on one fund and the reversion rule on none.
Why do mean-reversion strategies have such a high win rate?
Because they collect many small gains and occasionally take a large loss. The reversion rule won 69.3% of its trades with an average gain of 1.46%, but its average loss was 1.90% and its worst trade lost 13.9%, almost twice its best gain. Its five worst trades took back 35% of its total profit. The win rate describes the shape of the returns, not their size.
Why do trend-following strategies lose most of their trades?
A price that crosses a moving average often crosses back within days, producing a small loss called a whipsaw. The trend rule lost on 60 of 108 trades, with a median holding period of five days. Its profit came from the few trades that lasted: the five best supplied 70% of the sum of all trade returns.
Do markets trend or mean-revert?
Both, at different horizons. Published research finds reversal over days to a month, continuation over one to twelve months, and weak reversal over three to five years. On the S&P 500 the day-to-day pattern has also changed over time: from 1950 to 1989 a down day tended to be followed by another, and since 2000 by a rise.
Can you combine mean reversion and trend following?
The two rules had a monthly correlation of +0.21 on SPY. Half in each returned 8.1% a year with a Sharpe ratio of 0.63 and a worst fall of 20.0%, better risk-adjusted than either alone and still 2.7 points a year below buy-and-hold. Reversion trades opened above the 200-day average had a worst loss of 9.3%, against 13.9% for those opened below it.
How much do trading costs matter for each?
Roughly in proportion to turnover. At 10 basis points a trade the trend rule gave up about 0.7 points a year and the reversion rule about 2.5. Timing matters more: buying one day after the signal instead of at the signal’s own close reduced the reversion rule’s return from 9.4% to 7.0% a year and left the trend rule unchanged.
How we calculated this
- Data: dividend-adjusted daily closes of SPY, QQQ, IWM, EFA, EEM, TLT and GLD and the 13-week Treasury bill yield (^IRX) from Yahoo Finance, to 9 November 2026. The horizon tables use the S&P 500 price index (^GSPC) from 1950, without dividends. Cash earns the T-bill yield divided by 252 each day.
- Trend rule: long when the close is above its 200-day simple moving average, T-bills otherwise.
- Reversion rule: long from a close with a 2-day RSI (Wilder’s smoothing) below 10 until the first close above the 5-day simple moving average, T-bills otherwise.
- Execution: the position decided at close t is bought or sold at close t+1 and earns the return from t+1 to t+2. “At the signal’s own close” applies it one day earlier. Costs are charged once per full switch between the fund and T-bills.
- Trades: a round trip is the compounded return of the fund over consecutive days held, before costs. The “sum of all trade returns” adds those percentages; it is a measure of concentration, not of compounded profit.
- Same-exposure mix: a daily-rebalanced mix of SPY and T-bills with the rule’s average share of days in the market.
- Periods: SPY tests from January 1994; the seven-fund comparison from January 2006, the first full year in which all seven funds have a 200-day average.
- The calculation script and its output, kept with the article, reproduce every figure.
Sources
- Jegadeesh, N., “Evidence of Predictable Behavior of Security Returns”, Journal of Finance, 45(3), 1990.
- Lehmann, B. N., “Fads, Martingales, and Market Efficiency”, Quarterly Journal of Economics, 105(1), 1990.
- Nagel, S., “Evaporating Liquidity”, Review of Financial Studies, 25(7), 2012.
- Moskowitz, T. J., Ooi, Y. H. and Pedersen, L. H., “Time Series Momentum”, Journal of Financial Economics, 104(2), 2012.
- Hurst, B., Ooi, Y. H. and Pedersen, L. H., “A Century of Evidence on Trend-Following Investing”, Journal of Portfolio Management, 44(1), 2017.
- Poterba, J. M. and Summers, L. H., “Mean Reversion in Stock Prices: Evidence and Implications”, Journal of Financial Economics, 22(1), 1988.
- de Groot, W., Huij, J. and Zhou, W., “Another Look at Trading Costs and Short-Term Reversal Profits”, Journal of Banking & Finance, 36(2), 2012.
- Faber, M. T., “A Quantitative Approach to Tactical Asset Allocation”, Journal of Wealth Management, 9(4), 2007 — the moving-average rule.
- Connors, L. and Alvarez, C., Short Term Trading Strategies That Work, TradingMarkets, 2009 — the 2-day RSI rule.
- Prices: Yahoo Finance via yfinance, retrieved 10 November 2026.
Related reading
- The 10-month moving average on the S&P 500 — 92 years of the trend rule, bear market by bear market.
- How to read a backtest without fooling yourself — the four errors that inflate results like these.
- How to test a technical indicator before trusting it — the same-exposure and random-timing benchmarks.
- Does momentum investing work? — continuation across stocks, and its crashes.
- Which algorithmic trading strategies are actually profitable? — the five strategy families, after costs.
This article is general information, not personalised investment advice. It does not take into account the financial situation, objectives or risk tolerance of any individual reader, and the same text is distributed to all readers. The rules tested are illustrations of two strategy families, not trading recommendations. Past performance, real or simulated, does not indicate future results, and capital is at risk.