The 4% Rule at CAPE 40: What 1,509 Retirements Since 1871 Show, and the TIPS Alternative
Key takeaway
A 4% inflation-adjusted withdrawal from a 60/40 portfolio lasted 30 years in 96.8% of 1,509 monthly starts since 1871, and every failure began between 1964 and 1969. The first ten years of returns explain 75% of the outcome. No finished retirement began at today's CAPE of 40.6, but at 25 September 2026 real yields a 30-year TIPS ladder pays about 5% a year with no market risk.

The 4% rule says that a retiree can take 4% of a portfolio in the first year, raise that amount with inflation every year after, and not run out of money for 30 years. It is the most quoted number in retirement planning, and it was never meant as a forecast. It is the worst case of a particular historical record. That distinction matters more in September 2026 than it has in decades, for two reasons that point in opposite directions: US stocks start from a Shiller CAPE of 40.6, higher than at the start of any 30-year retirement that has finished, and inflation-protected Treasuries now pay enough to fund about 5% a year for 30 years with no market risk at all.
We rebuilt the test on every monthly starting point since January 1871, using Robert Shiller’s real total-return series for US stocks and 10-year Treasuries: 1,509 retirements that have run their full 30 years, the last one starting in September 1996. With 60% in stocks and 40% in bonds, 4% lasted in 96.8% of them. Every one of the failures began between 1964 and 1969. The more useful findings are about why: the first ten years of returns explain three quarters of a retirement’s outcome, starting valuations explain about half, and today’s starting point has no complete precedent.
The short answer, in one table
Each cell is the share of the 1,509 thirty-year retirements in which a fixed real withdrawal, set as a percentage of the starting balance, never exhausted the portfolio. Withdrawals are monthly, the mix is rebalanced monthly, and there are no fees or taxes.
| First-year withdrawal | 100% stocks | 75/25 | 60/40 | 50/50 | 25/75 |
|---|---|---|---|---|---|
| 3.0% | 100% | 100% | 100% | 100% | 100% |
| 3.5% | 99.7% | 100% | 100% | 100% | 99.5% |
| 4.0% | 97.9% | 98.0% | 96.8% | 96.4% | 83.0% |
| 4.5% | 93.0% | 91.9% | 88.9% | 86.5% | 58.8% |
| 5.0% | 83.7% | 81.4% | 75.7% | 69.3% | 48.4% |
| 6.0% | 71.0% | 63.4% | 55.5% | 50.3% | 34.3% |
Monthly retirement starts from January 1871 to September 1996; stocks are the S&P Composite with dividends reinvested, bonds are Shiller’s 10-year Treasury total-return series, both deflated by the CPI. Our calculation.
Two things stand out. The rule works for a wide band of stock allocations, from 50% to 100%, and it breaks down quickly for bond-heavy portfolios: with 25% in stocks, 4% failed in about one retirement in six. And the jump from 4% to 5% is not a small step. At 5% a 60/40 portfolio ran dry in almost one start in four.
Where the 4% came from, and how our test differs
The rule comes from William Bengen’s paper in the October 1994 Journal of Financial Planning. Using Ibbotson data from 1926, a 50/50 mix of stocks and intermediate-term Treasuries and one retirement start per year, he found that a 4% first-year withdrawal adjusted for inflation had never exhausted a portfolio in less than 33 years, while 4.25% could have run out in 28. He called 5% risky and 6% or more “gambling”, and recommended between 50% and 75% in stocks.
Our test uses a longer record (from 1871), a start every month rather than every January, and Shiller’s 10-year Treasury series instead of intermediate-term notes. Those choices make it slightly harsher: the worst start comes out at 3.72% for 60/40 and 3.67% for 50/50, rather than a little above 4%. Part of the difference is resolution. With annual starts you only see January; monthly starts also catch the worst month inside a bad year. The bond series and the longer record account for the rest.
Every failure started between 1964 and 1969
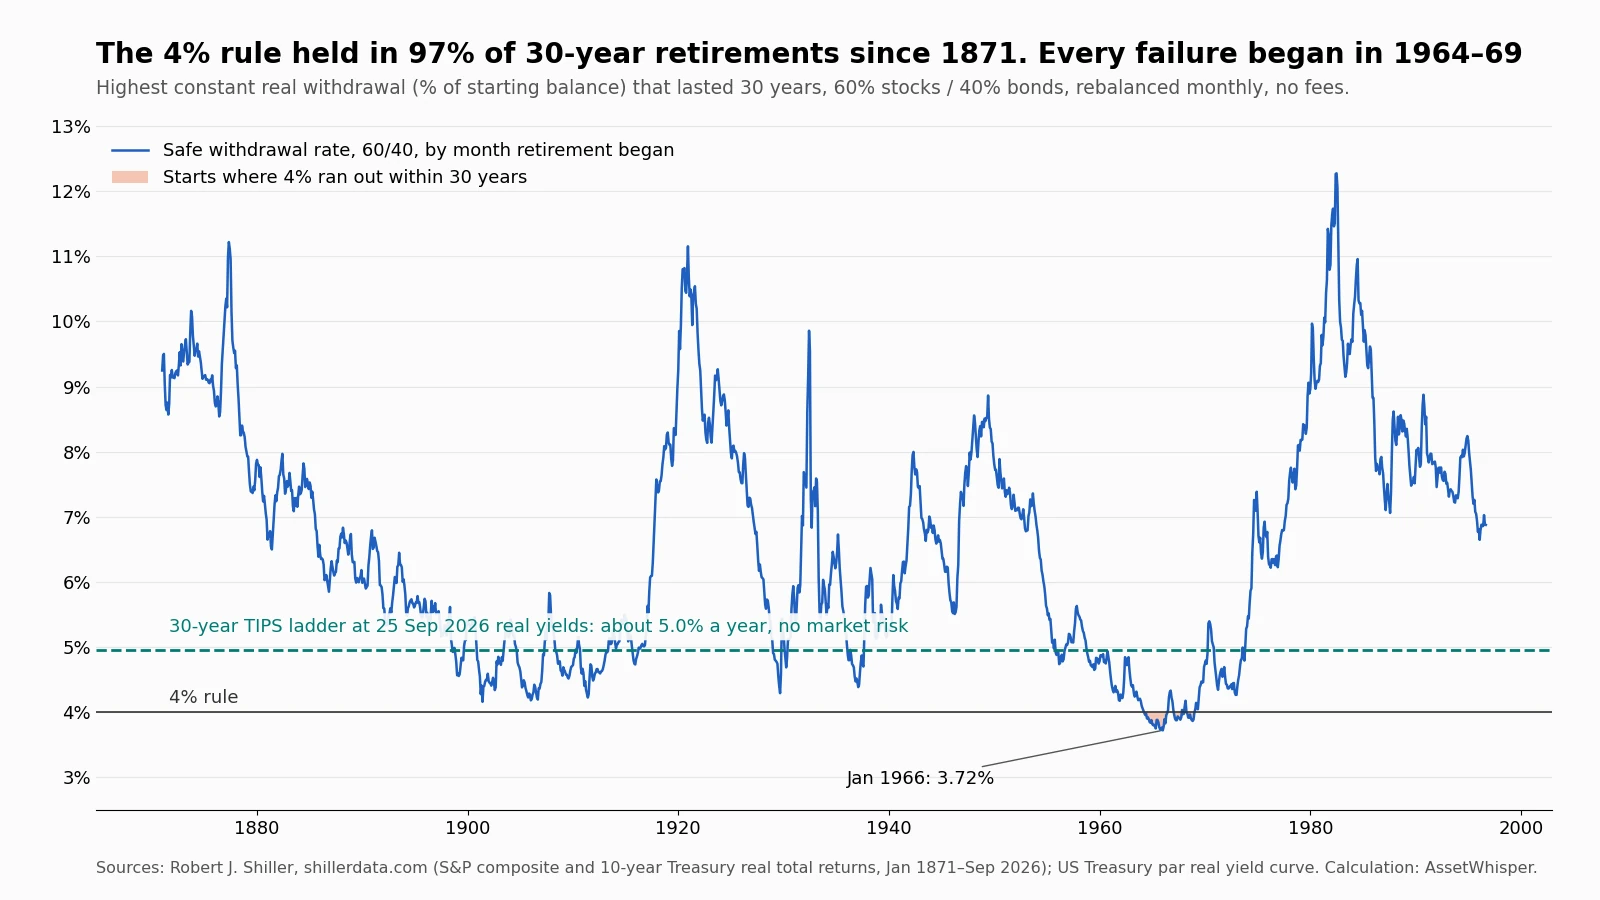
Of the 1,509 starts, 48 ran out of money at 4% with a 60/40 portfolio, and all 48 began between 1964 and 1969. The worst was January 1966. That retiree’s portfolio earned a real 4.13% a year over the full 30 years, which sounds adequate. The problem was the order. In the first decade the portfolio lost 1.47% a year after inflation, and by January 1976 the real balance was down to 49.2% of where it started, with the same withdrawal still coming out every month. The money ran out after 25.2 years.
What made the 1960s worse than 1929 was inflation. A retiree who started in September 1929, at the top before the crash, fared badly with all stocks: a 100% equity portfolio could only sustain 3.07%, the worst of any start in our data. But with 40% in Treasuries the same 1929 start could sustain 4.29%, because prices fell in the 1930s: in the decade from September 1929, consumer prices dropped 2.02% a year and Treasuries returned 6.17% a year after inflation. The 1966 retiree got the opposite. In the decade from January 1966 inflation averaged 5.75% a year, stocks lost 1.77% a year after inflation and bonds lost 1.52%, so diversification had almost nothing to offer. That is why the 1960s, not the Great Depression, set the floor for balanced portfolios.
The practical consequence: the 4% rule is not calibrated on a crash. It is calibrated on a decade of flat real returns with rising inflation, which is harder to see coming and lasts longer.
Sequence risk: the first ten years decide
Two retirements can earn the same average return and end very differently. We measured it directly. Across all 1,509 starts, the 30-year annualised real return of the 60/40 portfolio explains 40% of the variation in the safe withdrawal rate (R² = 0.40). The return over the first ten years alone explains 75%. The last ten years explain 14%.
The clearest pair in the record: a retirement that began in April 1970 and one that began in July 1920 earned almost the same over 30 years, 6.58% and 6.62% a year after inflation. The 1970 portfolio lost 1.72% a year in real terms over its first decade, and its owner could safely take 4.91%. The 1920 portfolio gained 14.73% a year in its first decade, and its owner could have taken 10.79%. Same average, more than twice the income, entirely because of the order in which the returns arrived.
This is the mechanism behind every other number in this article. Withdrawals in the early years are taken from a portfolio that has just fallen, so they lock in losses that the later recovery has less capital to repair. It also explains why the depth and duration of bear markets matter more to a retiree than to a saver: a saver who buys during a drawdown gains from it, a retiree who sells during one loses twice.
What a CAPE of 40 does to the numbers
If the first decade decides, the question is what predicts the first decade. Starting valuation is a strong guide in this data. The earnings yield at retirement (the inverse of Shiller’s CAPE) explains about half of the variation in the safe withdrawal rate (R² = 0.51) across the 1,389 starts for which CAPE exists, from 1881.
| CAPE when retirement began | Starts | Worst safe rate | Median safe rate | Share where 4% lasted |
|---|---|---|---|---|
| Below 10 | 229 | 5.86% | 8.54% | 100% |
| 10 to 15 | 458 | 4.34% | 6.42% | 100% |
| 15 to 20 | 498 | 4.17% | 5.46% | 100% |
| 20 to 25 | 182 | 3.72% | 4.45% | 74% |
| Above 25 | 22 | 4.16% | 4.90% | 100% |
60/40 portfolio, monthly starts from January 1881 to September 1996, 30-year horizon. Our calculation from Shiller data.
The top row is where the table stops being useful. Only 22 starting months in the complete record had a CAPE above 25, and they come from just three episodes: June 1901, late 1928 to 1930, and late 1995 to 1996. The highest starting CAPE of any finished 30-year retirement was 32.6, in September 1929. Shiller’s September 2026 reading is 40.6. There is no completed 30-year retirement that began at today’s valuation. If we group every start with a CAPE of 20 or more (204 months), 4% lasted in 76.5% of them, 4.5% in half, and 3.5% in all of them.
There are unfinished ones, and they are instructive. A 60/40 retiree who started in January 2000, at a CAPE of 43.8, is 26.7 years in at 4% and still has 60% of the starting balance in real terms, after withdrawing 107% of it. The same retiree with 100% in stocks has 18% left. The balanced portfolio survived a decade in which US stocks lost 3.03% a year after inflation, the worst calendar decade in Shiller’s record since 1880, because its bonds did well: the 10-year Treasury yielded 6.66% in January 2000 and fell for most of the following two decades. The retiree who started in December 2021, at a CAPE of 38.3 and with bond yields near historic lows, is 4.8 years in with 90% of the starting balance in real terms. That is fine so far, and it says little: in 1966 the damage took ten years to show.
The practical consequence: high valuations lower the expected safe rate, but what they do to a specific retiree depends on what bonds do at the same time. That is why the second half of this story is about bond yields, not stocks.
The alternative that did not exist five years ago
On 25 September 2026 the US Treasury’s real par yield curve for inflation-protected securities (TIPS) read 2.64% at 5 years, 2.83% at 10, 3.08% at 20 and 3.22% at 30. The 30-year figure is the highest close in that series, which begins in February 2010. The 10-year is the highest since November 2008. As recently as December 2021 the 30-year real yield fell to −0.59%.
A TIPS ladder uses those yields directly: buy a bond maturing in each of the next 30 years, sized so that principal plus interest from each year’s bond pays that year’s spending, adjusted for CPI. At the 25 September curve, the ladder pays about 4.96% of the starting sum a year in real terms if each year’s money is taken at the start of the year, or 5.11% if taken at the end. On $1 million that is about $49,600 a year in today’s dollars, guaranteed by the US Treasury in real terms, against $40,000 under the 4% rule. These are our approximations using par yields as discount rates; the price of an actual ladder on a given day will differ somewhat.
| Approach, 30 years | Real annual payout | What you keep | What you give up |
|---|---|---|---|
| 4% rule, 60/40 | 4.0% | Market upside; a median ending balance well above zero | Failed in 3.2% of starts since 1871, all in the 1960s |
| Morningstar’s 2025 base case | 3.9% | 30%–50% in equities, 90% modelled success | Forward-looking assumptions, not history |
| TIPS ladder, 25 Sep 2026 yields | about 5.0% | Real income with no market risk | All upside; the money is gone after year 30 |
The ladder’s payout is higher than the safe withdrawal rate that 23.3% of all 60/40 retirements since 1871 actually turned out to have, and higher than it was for 68.1% of those that began with a CAPE of 20 or more. That comparison is unfair in one direction, because the ladder’s 5% is fixed today while the historical rates were only known 30 years later. It is also unfair in the other, because the portfolio kept its upside and usually ended with money left over. What has changed is that the certain option now pays more than the rule’s historical worst case. When real yields were near zero, a 30-year ladder paid about 3.3%, less than the worst historical start for a 60/40 portfolio.
The ladder has real costs. It ends at year 30, so it does not protect against a longer life. It leaves nothing to heirs unless other assets do. In a taxable account the inflation adjustment on TIPS principal is taxed every year even though it is not paid out until maturity. The Treasury does not issue a TIPS maturing in every year, so ladders fill some gaps with neighbouring bonds. And the 5% is only available to someone who buys at these yields: if real rates fall, so does the payout on new ladders.
What this changes for a portfolio
None of this makes a withdrawal rate correct for a particular person. What it changes is the structure of the decision. Three points follow from the numbers above.
- The rate matters less than the first decade. A retiree who starts at 4% and cuts spending modestly after a bad first few years is in a different position from one who holds the withdrawal fixed through a 1966. Morningstar’s 2025 research found that flexible spending rules, such as guardrails that cut withdrawals after bad years, allowed higher starting rates than a fixed real withdrawal in its modelling.
- Fees are withdrawals too. With a 1% annual fee, the worst 60/40 start falls from 3.72% to 3.27%, and the share of starts where 4% lasted falls from 96.8% to 88.6%. At 0.25% the damage is small: 3.61% and 96.2%.
- Bonds are doing a different job than in 2021. At current real yields, the bond sleeve of a 60/40 portfolio can be a source of known real income rather than only a shock absorber. Splitting essential spending onto a ladder and leaving discretionary spending in a diversified portfolio is one way retirees use that, at the cost of upside on the laddered part.
To test a specific balance and spending level, our free retirement runway calculator shows how long a portfolio lasts at a given return and withdrawal. It uses a constant return, so it will not show sequence risk; the table and chart above are the reason to run it with a pessimistic return for the first years.
What this does not say
- It is one country’s history. The US had one of the best stock markets of the last 150 years. Studies of other countries find lower safe rates, and any US-only test flatters the rule.
- It is not a forecast. 1,509 overlapping monthly starts contain only about five non-overlapping 30-year periods. A 96.8% success rate is a description of the past, not a probability.
- It ignores taxes and assumes discipline. The model rebalances every month and never panics. Real retirees pay taxes on withdrawals and sometimes sell at the bottom, which the behaviour-gap research shows is expensive.
- Thirty years is an assumption. Someone retiring at 55 may need 40 years or more, and safe rates fall as the horizon lengthens.
- The ladder payout is an approximation from the Treasury’s par real curve on one day, interpolated between maturities, and it moves every day with real yields.
Frequently asked questions
Does the 4% rule still work in 2026?
Historically, a 4% inflation-adjusted withdrawal from a 60/40 portfolio lasted 30 years in 96.8% of monthly starts since 1871, and every failure began between 1964 and 1969. But no finished 30-year retirement began at today’s CAPE of 40.6, and among starts with a CAPE of 20 or more, 4% lasted in 76.5%.
What is the safe withdrawal rate for a 60/40 portfolio?
In our test from 1871, the lowest rate that lasted 30 years for every start was 3.72% (January 1966), the median start could sustain 6.33%, and 3.5% lasted in every case. Morningstar’s forward-looking 2025 estimate is 3.9% for portfolios with 30% to 50% in equities.
What is sequence of returns risk?
It is the risk that poor returns arrive early in retirement, while withdrawals are being taken from a shrinking portfolio. In our data the first ten years of real returns explain 75% of the variation in safe withdrawal rates, against 40% for the full 30-year average return.
Why was 1966 worse than 1929 for retirees?
In the 1930s prices fell, so Treasury bonds gained in real terms and cushioned a balanced portfolio. From 1966, stocks went nowhere after inflation for a decade while rising inflation also eroded bonds. A 60/40 retiree from September 1929 could sustain 4.29%; one from January 1966 only 3.72%.
How much income does a TIPS ladder pay now?
At the US Treasury’s real par yield curve of 25 September 2026, a 30-year TIPS ladder pays about 4.96% of the starting sum a year in real terms, roughly $49,600 on $1 million. That is our approximation; actual ladder prices vary, and the money is fully spent after 30 years.
Do fees change the safe withdrawal rate?
Yes. With a 1% annual fee, the worst historical 60/40 start falls from 3.72% to 3.27%, and the share of starts in which 4% lasted 30 years falls from 96.8% to 88.6%. At 0.25% the worst case is 3.61%.
How we calculated this
Real monthly returns come from Robert Shiller’s dataset (real total-return price of the S&P Composite, and his real total return on 10-year Treasuries), January 1871 to September 2026. Each retirement starts in a month from January 1871 to September 1996 and lasts 360 months. The withdrawal is fixed in real terms at the stated rate of the starting balance, taken monthly at the start of each month, and the portfolio is rebalanced monthly. The safe withdrawal rate of a start is the highest rate that leaves the balance above zero after 360 withdrawals, found numerically. The TIPS ladder discounts 30 equal real payments at the Treasury’s par real yields, interpolated linearly between the 5, 7, 10, 20 and 30-year points and treated as zero-coupon rates.
Sources
- Robert J. Shiller, Stock Market Data Used in Irrational Exuberance (monthly S&P Composite, dividends, CPI, 10-year Treasury rate, CAPE and real total returns), release of 2 September 2026.
- US Treasury, daily par real yield curve rates, 2010 to 25 September 2026.
- William P. Bengen, “Determining Withdrawal Rates Using Historical Data”, Journal of Financial Planning, October 1994 (reprinted March 2004).
- Amy C. Arnott, Christine Benz and Jason Kephart, “What’s a Safe Retirement Withdrawal Rate for 2026?”, Morningstar, 3 December 2025, summarising The State of Retirement Income: 2025.
Related reading
- Stocks now yield less than real Treasuries on CAPE — the valuation side of the same September 2026 picture.
- Bear markets since 1950 — how long recoveries take in real terms, which is what a retiree lives through.
- Is 60/40 still alive? — what the bond sleeve does when real yields are this high.
- The 10-year Treasury at 5% — why the rise in yields came from real rates, the same move that lifted TIPS.
- How often should you rebalance? — the rule behind the monthly rebalancing assumed here.
- Why savings lose value — inflation, the variable the 4% rule is built to absorb.
This article is general information, not personalised investment advice. It does not take into account the financial situation, objectives, tax position or risk tolerance of any individual reader, and the same text is distributed to all readers. Historical simulations describe the past under stated assumptions and are not forecasts; yields quoted describe the dates stated and change continuously. Capital is at risk.