What Type of Investor Are You? The 10-Question Risk Profile Quiz
Key takeaway
Your investor profile is the lowest of three limits, not the highest risk you will accept: time horizon, financial capacity and emotional tolerance. A ten-question quiz scored so the tightest constraint wins, with sourced return assumptions and no expected-return promises.
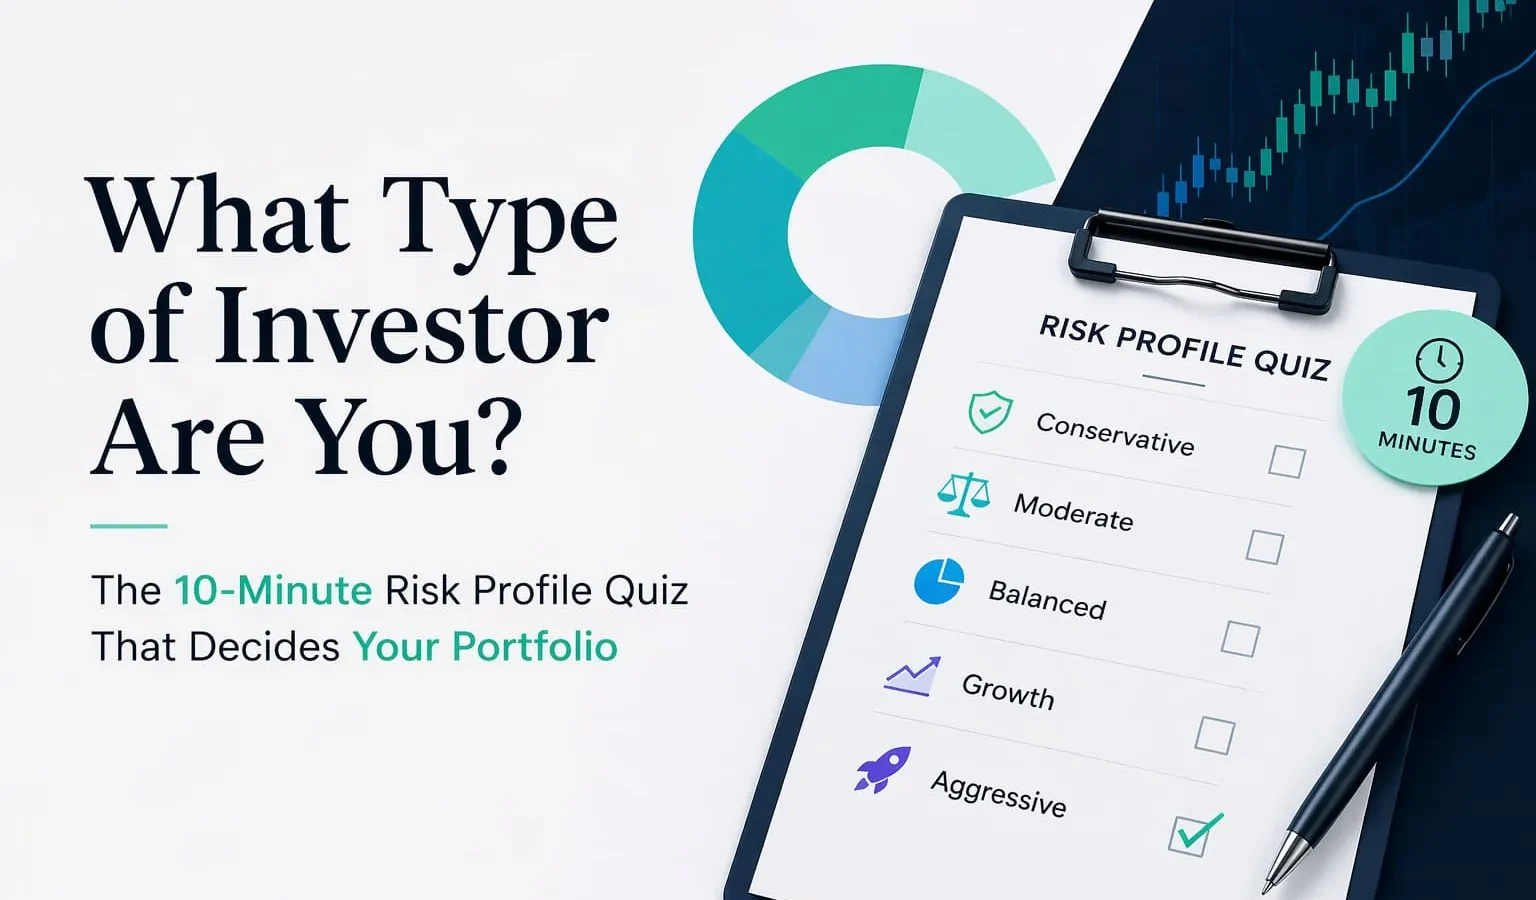
The short answer: your investor profile is not the highest level of risk you are willing to take. It is the lowest of three separate limits — how long until you need the money, how much loss your finances can absorb, and how much volatility you can live with without selling. Most risk quizzes add ten answers together and let a strong nerve cancel out a short horizon. That is arithmetic, not risk profiling. The quiz below is built so the tightest constraint wins.
The distinction matters because the three limits fail differently. Exceed your tolerance and you sell at the bottom. Exceed your capacity and a job loss forces you to sell at the bottom. Exceed your horizon and the calendar forces you to sell, whatever the market is doing that month. Only the first is about temperament, and it is the one every quiz measures best and weights most.
An illustrative case: two colleagues, one decision
The following example is illustrative. David and Rachel are not real people; the figures are arithmetic constructed to show how the decision compounds, not a record of anyone’s account.
Two colleagues at the same agency, similar salaries, both in their late thirties. In January 2020 each committed $50,000.
David went with conviction. Tech, a couple of crypto positions, some thematic ETFs. By late 2020 he was up 70%, to roughly $85,000. Through 2022 the position fell hard, and in June 2022, near the low, he sold almost everything at about $32,000.
Rachel spent fifteen minutes on a risk assessment first. It told her she was a moderate investor: someone who wanted growth but whose sleep suffered when her balance moved 10% in a week. She put the $50,000 into a diversified portfolio of roughly 60% global equities and 40% bonds and alternatives. In 2022 it fell about 16%. She did not sell. By April 2026 the position was worth about $72,000, which over that six-and-a-quarter-year period is an annualised return of roughly 6.0%.
Here is the part most versions of this story get wrong. David’s allocation was not the mistake. Held through to 2026, a concentrated technology portfolio would very likely have recovered and beaten Rachel’s — that is what happened to the sector. His mistake was owning a portfolio whose worst month he could not sit through. The allocation was defensible; his ability to hold it was not, and only one of those two things was knowable in advance.
The practical consequence: the question a risk profile answers is not “what is the best portfolio?” It is “what is the most aggressive portfolio I will still own at the bottom?”
What the evidence actually says about the cost of not holding
The claim that investors lose several percentage points a year to bad timing is widely repeated and usually overstated. Here is what a specific, current study measures.
Morningstar’s Mind the Gap study estimates the difference between the returns funds report and the returns the average dollar in those funds actually earns, which differs because money arrives and leaves at uneven times. For the ten years ended 31 December 2025, across roughly $13.6 trillion in US mutual funds and ETFs, Morningstar found the average dollar earned 8.7% a year while the funds themselves returned 9.9% — a gap of about 1.2 percentage points a year.
That is a real and expensive gap, and it is roughly in line with what the same study found for the ten-year periods ending 2021 through 2024. It is also considerably smaller than the three to five points often quoted. And it is contested: a 2026 Financial Analysts Journal paper argues that even this figure overstates the cost of bad timing, on the grounds that the calculation is sensitive to how cash flows are weighted.
So the honest version of the argument is narrower than the usual one, and it survives the narrowing: the gap is real, it is measured in single digits rather than double, and the behaviour it captures — adding after gains and cutting after losses — is exactly what a mismatched portfolio produces.
The four profiles
Most assessment frameworks land on some variation of four profiles. What follows deliberately omits an “expected return” column, and the next section explains why.
| Profile | Equity allocation | Minimum horizon | Loss to expect in a 2008-scale bear market | What it optimises for |
|---|---|---|---|---|
| Conservative | 20–30% | 3 years | −10% to −15% | Keeping the capital intact and ahead of inflation |
| Moderate | 50–60% | 5 years | −25% to −32% | Growth you can hold through a bad decade |
| Dynamic | 75–85% | 10 years | −40% to −45% | Long-run growth, accepting long recoveries |
| Aggressive | 90–100% | 15 years | −50% to −55% | Maximum long-run growth, accepting maximum pain |
How the drawdown column is calculated. The MSCI World index fell roughly 55% peak to trough between October 2007 and March 2009 and took over four years to recover. The figures above apply each profile’s equity weight to that decline and assume the bond portion held its value, which it broadly did in that episode. They are arithmetic, not a forecast. In 2022 the arithmetic broke down in the other direction: equities and bonds fell together, and a 60/40 portfolio lost around 16% for the year with no help from the bond side.
Read that column as the number you are agreeing to sit through. If it makes you uncomfortable on paper, with no money at stake, it will not become easier when it is your balance.
What returns to expect, and why this article does not put a number in the table
The earlier version of this article attached expected annual returns to each profile, rising to 12–18% for the aggressive one. That was not defensible, and it has been removed. Here is what published forward-looking assumptions actually say, with their dates.
- Vanguard, from the 30 June 2026 run of its Capital Markets Model, projects annualised returns of roughly 4.2% to 6.2% for US equities over the following ten years.
- J.P. Morgan Asset Management, in its 2026 Long-Term Capital Market Assumptions published in October 2025, projects 6.7% a year for US large-cap equities and 6.4% for a USD 60/40 portfolio over a 10-to-15-year horizon.
These are nominal, before fees and taxes, they are model output rather than promises, and different houses disagree with each other by meaningful margins. What they have in common is that none of them supports a headline expectation of 12% or more from a diversified portfolio, however aggressive. A portfolio can certainly deliver that. Planning on it is a different matter.
The practical consequence: use a range and a source, or use no number at all. A quiz result that arrives attached to a precise return figure is selling something.
Why this quiz is not scored by adding up the answers
The standard risk quiz gives each answer one to four points, adds the ten, and reads the total off a table. It is easy to build and easy to explain, and it produces results that are wrong in a specific, predictable way.
Consider someone who needs this money in under a year, and who answers every other question at the top of the scale: under thirty, high stable income, no dependents, experienced, unshakeable in a crash. Under flat scoring that is 37 out of 40 and the result reads Aggressive. The quiz has just told a person with an eleven-month horizon to hold 95% equities.
The flaw is structural. Adding scores treats every input as a preference that can be traded against another. But horizon is not a preference, and neither is capacity. They are constraints. A strong stomach does not extend your time horizon by a single day, and no amount of experience makes an unstable income more able to absorb a 40% loss.
So this quiz keeps the same ten questions and scores them in three separate parts. Two questions act as gates that cap the result. Eight are scored, four for capacity and four for tolerance. Your profile is the lowest of the four outcomes, not the average.
The quiz: two gates and eight questions
Instructions: answer with the option that honestly fits you, not the one you would prefer to be true. Keep the two gate answers separate from the two scores. There is also an interactive version of this quiz that does the arithmetic and shows you which constraint is binding; nothing you enter there is stored or sent anywhere.
Gate 1 — Time horizon
When do you realistically expect to need this specific money?
- A) In less than 1 year. → This is not a portfolio question. Money needed inside a year belongs in cash or short-dated instruments, whatever your temperament. Stop here.
- B) In 1 to 3 years. → Ceiling: Conservative.
- C) In 3 to 10 years. → Ceiling: Dynamic.
- D) More than 10 years away. → No ceiling.
Gate 2 — What this money is for
What is your actual objective for it?
- A) Preserve capital. Not losing it matters more than growing it. → Ceiling: Conservative.
- B) Beat inflation with modest growth. → Ceiling: Moderate.
- C) Grow meaningfully over the long run. → Ceiling: Dynamic.
- D) Maximise growth, accepting the volatility that comes with it. → No ceiling.
Part A — Risk capacity: what your finances can absorb
Score 1 to 4 points for each answer and add the four.
Question 1 — Age. How old are you?
A) 60 or older (1) · B) 45 to 59 (2) · C) 30 to 44 (3) · D) Under 30 (4)
Question 2 — Income stability. How would you describe your monthly income?
A) Unpredictable. Some months are good, others are rough (1) · B) Stable, but little left after expenses (2) · C) Stable, with a meaningful monthly surplus (3) · D) Stable, with a large surplus or several income streams (4)
Question 3 — Dependents. Who depends on your income?
A) Children and other family members (1) · B) A partner and children (2) · C) A partner only (3) · D) Only me (4)
Question 4 — Concentration. What share of your total net worth, including property and savings, does this money represent?
A) More than 80% (1) · B) 50% to 80% (2) · C) 20% to 50% (3) · D) Less than 20% (4)
Capacity ceiling: 4–7 points → Conservative · 8–10 → Moderate · 11–13 → Dynamic · 14–16 → Aggressive.
Part B — Risk tolerance: what you can live with
Score the same way.
Question 5 — A sharp drop. Your portfolio falls 25% in a single month. What do you actually do?
A) Sell everything. I can’t handle the stress (1) · B) Sell part of it to reduce exposure (2) · C) Hold. Drops happen (3) · D) Buy more (4)
Question 6 — Experience. What have you actually invested in before?
A) Nothing beyond a savings account (1) · B) Savings accounts, term deposits, money market funds (2) · C) Funds, ETFs or index trackers (3) · D) Individual shares, options or more complex products (4)
Question 7 — Headline reaction. You read: “Global markets fall 40% this week.” Your first reaction is…
A) Panic. I would consider pulling everything out immediately (1) · B) Concern. I would want to talk to someone before deciding (2) · C) It happens. I would check my plan still makes sense and move on (3) · D) Opportunity (4)
Question 8 — What you did last time. Think of a real occasion when an investment, a pension or your home fell in value. How did you actually behave, not how you felt?
A) I sold, or I avoided investing afterwards (1) · B) I held, but checked the balance constantly (2) · C) I held and largely ignored it (3) · D) I added to the position (4)
Tolerance ceiling: 4–7 points → Conservative · 8–10 → Moderate · 11–13 → Dynamic · 14–16 → Aggressive.
Your result
Write down all four outcomes: the horizon ceiling, the objective ceiling, the capacity band and the tolerance band. Your profile is the lowest of the four. The one that produced it is the constraint that is actually governing your portfolio, and it is more useful to know than the label itself.
If capacity is binding, more capital or a more stable income changes your profile. If tolerance is binding, experience and a smaller position size may change it over years. If horizon is binding, only time changes it, and no amount of confidence substitutes.
Reading the four profiles
Conservative
You are here because at least one of the four constraints is tight: a horizon under three years, a stated preference for preservation, dependents and unstable income, or a genuine inability to watch balances fall. Any one of those is enough, and none of them is a weakness.
A portfolio at this level leans on assets that pay you while you wait and that do not move with equities. Dividend-paying equities matter here because the cash flow arrives regardless of the price, and defensive sectors — utilities, staples, healthcare — usually form the equity core.
What tends to go wrong at this level: reaching for yield in instruments whose risk is not visible in the yield, and treating a conservative allocation as a licence to stop paying attention to inflation.
Moderate
The most common outcome, and across a lifetime often the best risk-adjusted one. You want real growth and you are honest that a 40% fall would be painful enough to change your behaviour.
Diversification is the whole strategy here, and it means holding assets that respond differently to the same event rather than several versions of the same bet. Our guide to managing risk in a portfolio covers the mechanics, and because the bond side is directly exposed to rate cycles, how interest rates move through a portfolio is worth understanding before you set the split. Whether the classic 60/40 still does its job is a live question, which we take apart in Is 60/40 still alive?
What tends to go wrong at this level: overweighting one theme until the portfolio is a single bet in disguise, and rebalancing in response to the news rather than to a rule.
Dynamic
Time is the asset doing the work. A ten-year-plus horizon, finances that can absorb a bad decade, and a demonstrated ability to watch a quarter of the value disappear without acting.
At this level the allocation is mostly equities, and the meaningful decisions are about breadth and cost rather than cleverness. If you tilt toward a theme, size it as a satellite around a broad core: our pieces on AI-focused ETFs and sustainable sector ETFs describe what is actually inside those instruments, which is usually less diversified than the label suggests.
What tends to go wrong at this level: confusing a long horizon with a licence to concentrate, adding leverage, and checking the balance daily, which reliably produces more trading rather than better trading.
Aggressive
Long horizon, stable finances, real experience, and a track record of sitting through severe declines. The open question is no longer whether you can take risk, but whether the risk you take is compensated.
The discipline that matters most here is position sizing, because at this level a single concentrated mistake is the thing that ends the compounding — the arithmetic is in position sizing and risk of ruin. Judging whether a strategy earns its volatility is what the Sharpe ratio was built for, and selective hedging is about capping the outcomes that would force a decision, not about avoiding losses.
What tends to go wrong at this level: mistaking aggression for a lack of structure. An aggressive investor can perfectly well hold 100% broad global equities. Nothing about a high risk tolerance requires thematic funds, active systems or crypto, and a quiz that hands you those as a result has stopped measuring you and started selling to you.
What this quiz cannot tell you
How much risk you need to take. Practitioners split risk three ways: capacity, tolerance and required return — the risk implied by the goal you are funding. This quiz measures the first two. The third needs a target amount and a date, which a general article cannot know. It matters because the required return frequently exceeds the other two, and the standard response is to take risk beyond capacity in order to reach the goal. That is how retirement plans fail twice: once in the market, once at the deadline. When required exceeds capacity, the answer is to change the goal, the contribution or the date.
What you will actually do. This is a self-report questionnaire. It records what you believe about yourself in a calm moment. Question 8 is the only one that asks about behaviour rather than intention, and it is the one worth weighting in your own mind. Stated tolerance and revealed tolerance are different things, and the second is only ever measured during a decline you did not choose. Treat a result at the boundary as an argument for the lower profile.
If you land between two profiles
Take the lower one. The asymmetry is not symmetric: a portfolio slightly less aggressive than you could bear costs you some return, compounded over decades, which is a real cost and not a trivial one. A portfolio more aggressive than you can hold costs you the difference between staying invested and selling at the low, and that loss is realised rather than paper. The first mistake is expensive. The second is the one that ends the plan.
Frequently asked questions
How often should I retake this?
When something changes the inputs: a birth, a marriage, an inheritance, a job change, a diagnosis, retirement approaching. Otherwise every two or three years. Horizon shortens on its own, which means a profile decays even when nothing else happens.
What if the result doesn’t match how I see myself?
Look at which of the four outcomes produced it. If a gate produced it, the result is not a judgement about your character; it is a statement about a date or an objective you supplied. If the tolerance band produced it and you disagree, the honest test is Question 8: what you did the last time it happened, not what you expect to do next time.
Can I be different profiles for different money?
Yes, and most people should be. The horizon and objective gates are properties of a specific pot of money, not of you. A house deposit needed in two years and a pension needed in twenty-five are different profiles held by the same person, and merging them into one number is a common and expensive error.
Does a higher profile mean a better portfolio?
No. It means a portfolio with a wider range of outcomes. On J.P. Morgan’s own 2026 assumptions, a USD 60/40 portfolio is projected at 6.4% a year against 6.7% for US large-cap equities — roughly a third of a percentage point — while the drawdown difference between those two profiles in a 2008-scale decline is more than twenty points. Forecasts of that kind carry wide error bars and the realised gap has been larger in some decades, but the shape of the trade is the point: you are paying in drawdown for a return difference that is far smaller than the risk difference, and it only pays off if you hold on.
A profile decays if nobody maintains it: a 60/40 left alone through three good years becomes a 70/30, which is the next profile up. How often you should rebalance works through the arithmetic.
Related reading
- How emotions affect investment decisions — why the selling happens at the bottom rather than anywhere else.
- Is 60/40 still alive? — what broke in 2022 and what replaces the assumption.
- Position sizing and risk of ruin — how much to put in each position so a losing streak is survivable.
- Lump sum versus dollar-cost averaging — what the evidence says about how to deploy the money once the profile is set.
- Why savings lose value every year — the cost of the conservative extreme.
Free tools on AssetWhisper
This section describes what this site offers. It is separated from the analysis above deliberately: nothing in the profiles is written to lead you here.
- Risk profile quiz — the interactive version of the questions above. It applies the gates and shows which constraint is binding. Nothing is stored or transmitted.
- Investment calculator — compounding, retirement runway, realised returns and dollar-cost averaging.
- Technical indicators — open indicators published for TradingView, with their inputs and logic documented.
AssetWhisper does not manage money, does not sell portfolios and does not publish trade signals. See the editorial policy for how these articles are produced and checked.
Corrections. This article was substantially revised on 9 September 2026. The following errors in the previous version were corrected: (1) the illustrative example described a return of 8.2% a year, when the figures and period given produce approximately 6.0%; (2) a claim that the average investor trails their funds by 3 to 5 percentage points a year was unattributed and overstated, and has been replaced with Morningstar’s estimate of about 1.2 points for the decade to 31 December 2025, together with the academic objection to it; (3) the profile table gave expected annual returns of up to 12–18%, which no published long-run assumption supports, and the column has been removed in favour of sourced forecasts; (4) the typical drawdown figures understated historical losses and have been recalculated against the 2007–09 bear market; (5) the scoring model summed ten equally weighted answers, which allowed a short time horizon to be offset by a high risk tolerance, and has been replaced by a model in which horizon, objective and capacity each cap the result; (6) the portfolio descriptions prescribed thematic funds and active trading systems as a consequence of a risk profile, which does not follow, and the commercial material has been moved into a clearly separated section; (7) several internal links returned 404 and have been repointed.
About this publication. This article is general information about risk profiling methodology and is not personalised investment advice: it does not take into account the financial situation, objectives or risk tolerance of any individual reader, and the same text is distributed to all readers. It is not a recommendation to buy or sell any financial instrument. Allocation ranges are illustrations of how profiles are commonly structured, not proposed portfolios. All forward-looking figures are attributed to their source and date and are model output, not predictions. Past performance does not indicate future results, and capital is at risk. AssetWhisper is not a registered investment adviser. Full disclaimer.