Gold and Real Yields: The Link That Never Broke, and the 3.7× It Never Explained
Key takeaway
Real yields explained about a quarter of gold's monthly moves in 2003–2021 and about a sixth since, and the link has barely weakened. Yet the same relationship, applied to 2022–2026, implies a 13% fall in gold; it rose 136%. Gold also cushioned only two of the last four equity bear markets.
Gold futures closed at a record 5,318.4 dollars on 29 January 2026. The next session they fell 10.8%, and the SPDR gold ETF, GLD, lost 10.3%, its worst day since it began trading in 2004. On 25 September gold was 18.7% below that peak, and on 28 September GLD dropped another 3.94% in one session. Anyone who holds gold as a hedge has spent the year asking what actually drives it.
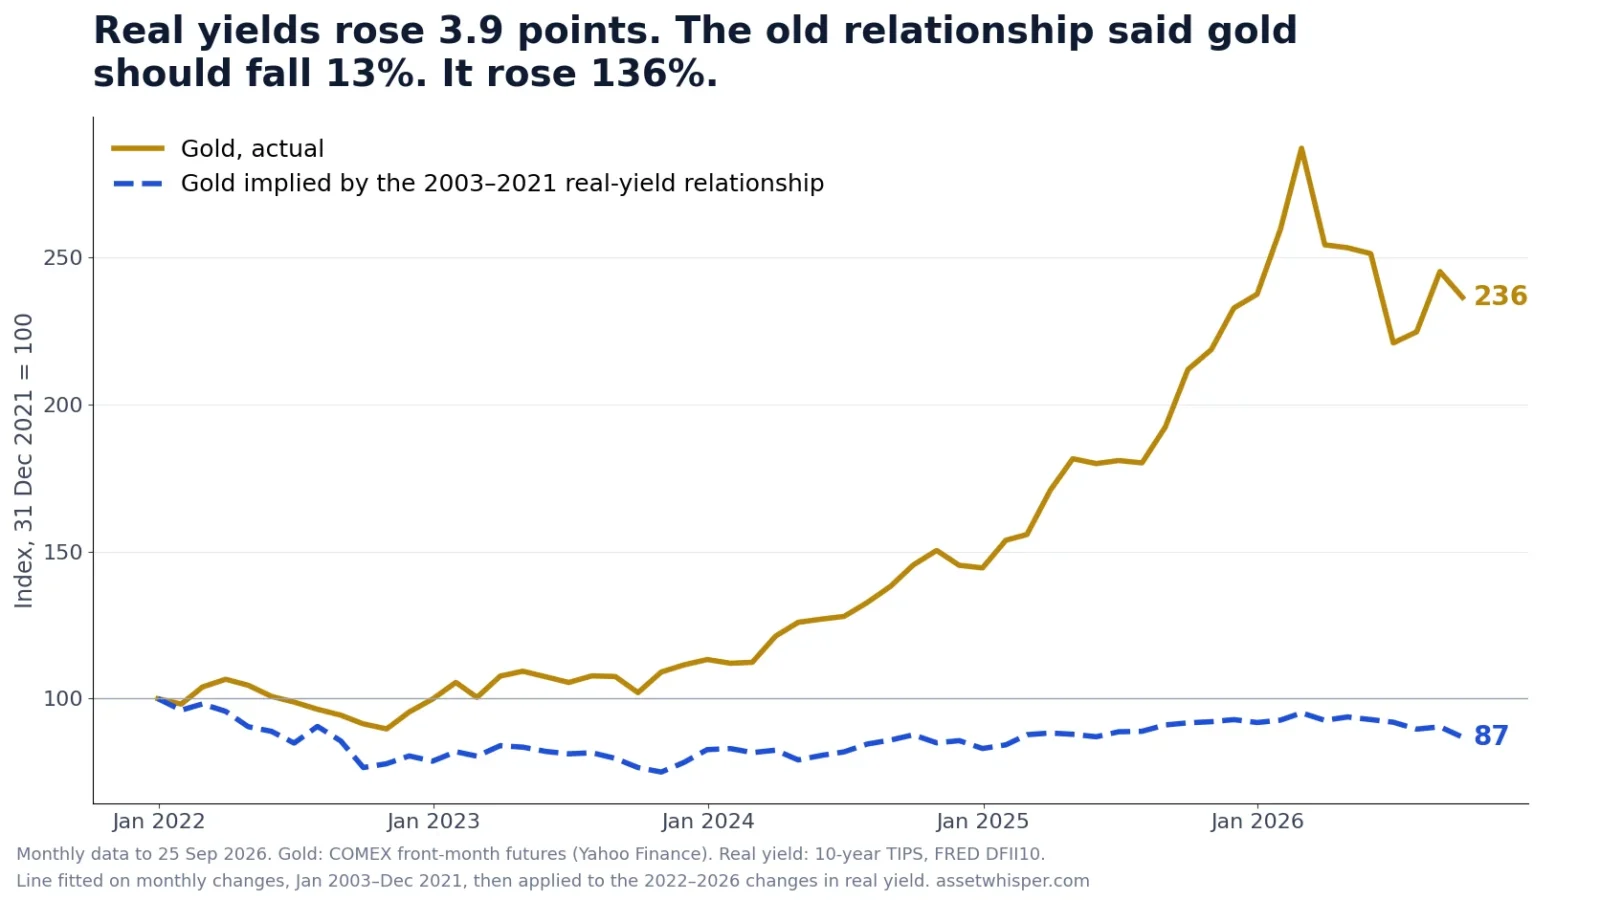
The standard answer is the real yield: the return on inflation-protected Treasuries. When it rises, gold, which pays nothing, becomes more expensive to own. We tested that claim on 284 months of data. The first result is that the link has been remarkably stable: real yields explained about a quarter of gold’s monthly moves in 2003–2021 and about a sixth since. The second is less comfortable. Applied to the last four and three-quarter years, the same relationship says gold should have fallen by 13%. It rose by 136%.
The short answer, in one table
We regressed gold’s monthly log change on the monthly change in the 10-year TIPS yield (FRED series DFII10), using the last trading day of each month. Gold is the COMEX front-month futures contract.
| Period | Months | Correlation | R² |
|---|---|---|---|
| 2003–2011 | 107 | −0.45 | 0.20 |
| 2012–2021 | 120 | −0.55 | 0.30 |
| 2003–2021 (the fit) | 227 | −0.49 | 0.24 |
| Jan 2022 – Sep 2026 | 57 | −0.41 | 0.17 |
Monthly data to 25 September 2026, the last date with a published real yield when we ran this. The sign never flips and the strength barely moves: the month-to-month relationship did not break in 2022. On the fitted line, a rise of one percentage point in the real yield in a month went with a gold move of about −11.6%, on top of a drift of +0.54% a month. Three-quarters of gold’s monthly variance, though, was never explained by real yields, even in the good years.
What the old line says about 2022–2026
A relationship that holds month by month can still miss the level. We fitted the line on data to December 2021 and then fed it the actual real-yield changes that followed, without refitting. The 10-year real yield went from −1.04% at the end of 2021 to 2.83% on 25 September 2026, a rise of 3.87 points. Gold went from 1,828.6 to 4,321.2 dollars.
| Jan 2022 – Sep 2026 | Change in gold |
|---|---|
| Implied by the old line (slope and drift) | −13.1% |
| Implied by the slope alone (real-yield channel only) | −36.1% |
| Actual | +136.3% |
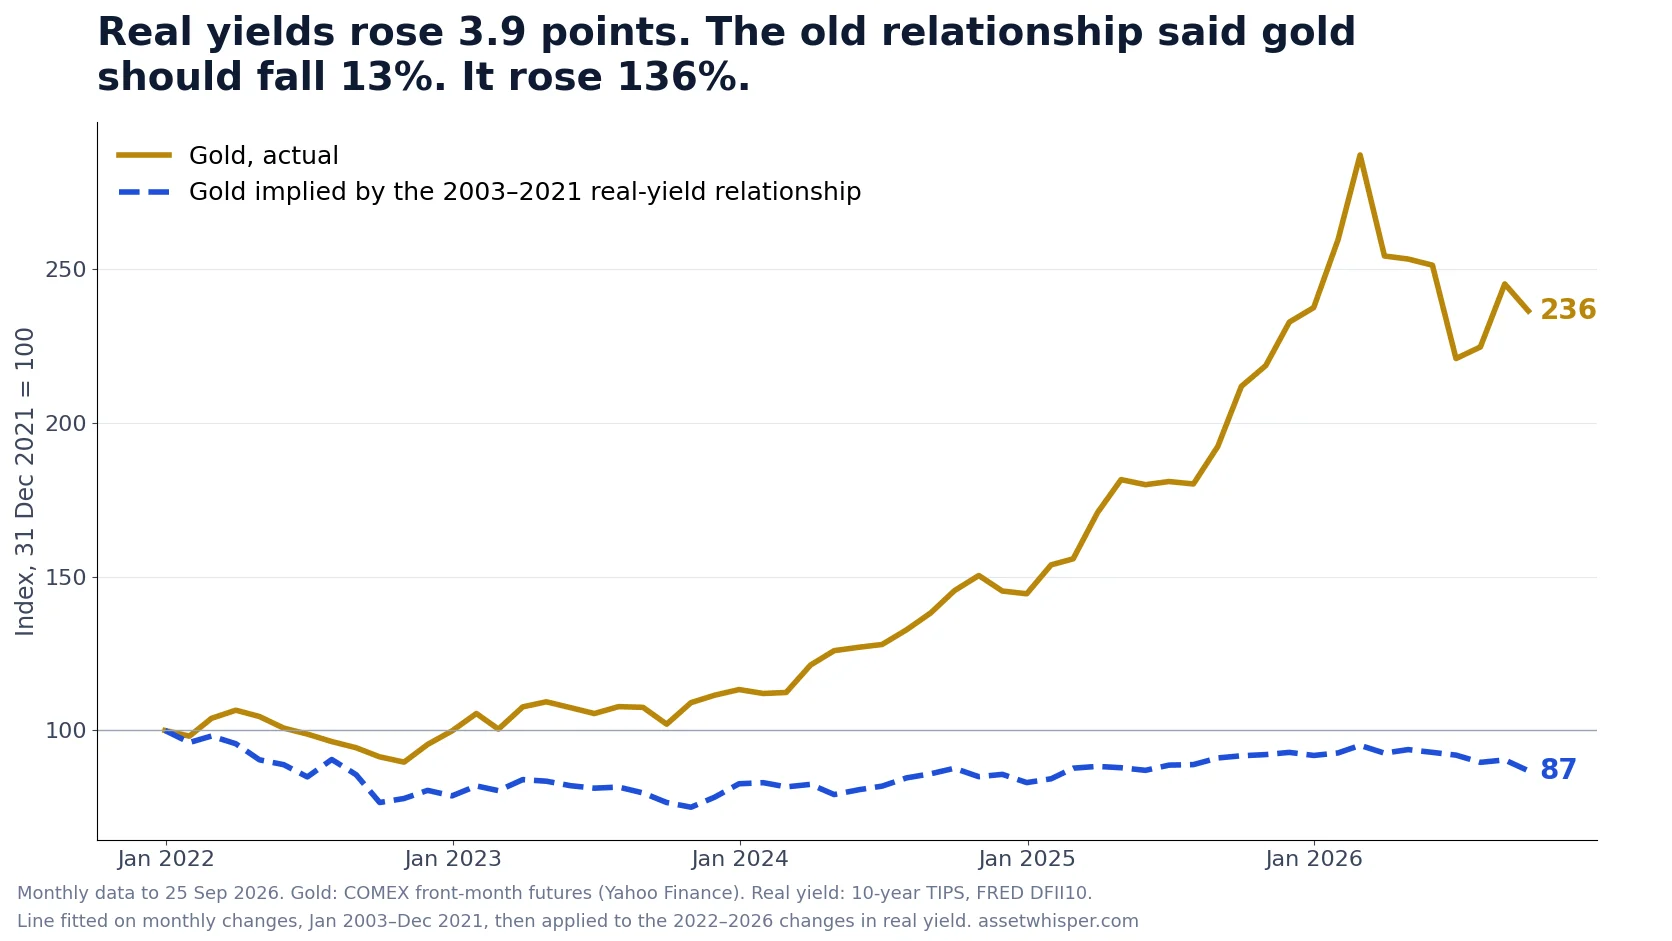
The line’s out-of-sample R² for 2022 onward is −0.02: it predicts the period no better than simply using the period’s own average. In log terms, the real-yield channel alone subtracted about 0.45 from gold’s path, and the total was +0.86, so everything else added about 1.31, a factor of 3.7. Gold’s average monthly gain went from 0.71% in 2003–2021 to 1.51% since.
The result does not depend on the futures series. Repeating the exercise with GLD, from its launch in November 2004, gives a slope of −12.3% per point, R² of 0.25 and an implied 2022–2026 change of −18.4% against an actual +130.1%.
The rolling link dipped in 2025, then recovered
A 24-month rolling correlation tells the same story from another angle. It ranged from −0.89 in December 2017, when gold and real yields moved almost mirror-image, to +0.06 in October 2006. At the end of 2022, 2023 and 2024 it read −0.37, −0.49 and −0.42, inside the normal range. At the end of 2025 it fell to −0.15, the weakest year-end reading since 2006, in a window that contained gold’s steepest gains, and the latest reading is back at −0.47. Real yields still matter at the margin. They stopped mattering for the trend.
What filled the gap
Our test cannot say what did. It can only say what the real-yield channel does not. The candidates are the ones the gold market itself names, and the World Gold Council’s Gold Demand Trends for the second quarter of 2026 (published 30 July) gives the current picture:
- Central banks bought 289 tonnes in the quarter, which the Council describes as a recovery to “the lofty levels that have been typical in the last four years”, after a slower first quarter that followed a downward revision to its data. A buyer that is not comparing gold with a TIPS yield does not respond to it. We covered that force in our May gold outlook.
- ETF holders did respond to rates: gold ETFs saw outflows of 45 tonnes, which the Council attributes to weaker prices and, in North America, “upward adjustments to both inflation and interest rate expectations alongside a strengthening US dollar”. The channel still works for the investors who use it.
- Jewellery demand, the buyer most sensitive to price, fell to 278 tonnes, its lowest quarter since the pandemic, even as spending on jewellery rose 14% in dollars.
The quarter’s average LBMA price was 4,506.29 dollars, 8% below the first-quarter record and 37% above a year earlier. Reading these together is a hypothesis, not a result: a slice of the market that is insensitive to real yields grew large enough to lift the level, while the slice that is sensitive still sets the month-to-month moves. That fits both facts in the tables above, but the data here cannot prove it.
Gold in the four equity bear markets it has lived through
Gold is also held as a hedge against stocks, which is a different claim from gold responding to real yields. We measured gold, close to close, over the four S&P 500 declines of the period, the peak-to-trough windows of the bear markets we tabulated in Bear Markets Since 1950 (the 2000–2002 window starts on 1 September 2000 because Yahoo’s gold series begins on 30 August 2000).
| S&P 500 decline | S&P 500 | Gold | Gold’s worst point in the window | Change in 10-year real yield |
|---|---|---|---|---|
| Sep 2000 – Oct 2002 | −48.9% | +15.4% | −7.9% | n/a (series starts 2003) |
| Oct 2007 – Mar 2009 | −56.8% | +24.5% | −4.4% | −0.28 pp |
| Feb – Mar 2020 | −33.9% | −2.5% | −8.1% | +0.05 pp |
| Jan – Oct 2022 | −25.4% | −6.8% | −9.3% | +2.59 pp |
Gold cushioned the two long declines, 2000–2002 and 2007–2009, and did not cushion the fast crash of 2020 or the rate-driven bear market of 2022, when real yields rose by 2.6 points. That is four episodes, too few for a statistical claim, and 2020 is not explained by real yields at all, since they were flat. What the table does show is that gold’s record as an equity hedge is uneven and that it depends on what is hurting stocks. In 2022, the bear market in which real yields rose, gold lost value alongside stocks. Real yields are rising again: our note on the 10-year at 5% shows that the 2026 rise in Treasury yields came entirely from real rates.
What the data supports, and what it does not
- Supported: in any given month, a rise in real yields has gone with a fall in gold for more than twenty years, including since 2022. It is a tendency, not a law: it explains about a fifth to a quarter of the variance.
- Supported: the real-yield channel does not account for gold’s trend since 2022. Something else contributed a factor of about 3.7.
- Not supported by these data: that the extra return will continue, or reverse. A drift of 1.5% a month that a fitted line cannot explain is not a parameter to extrapolate.
- Not supported: that gold protects a portfolio in every bear market. It did in two of four.
For a portfolio, this means the size of a gold position has to be justified by what it does, not by a story about rates. A holding that fell 18.7% from its peak in eight months has a volatility that belongs in the risk budget, the subject of our piece on position sizing, and it sits alongside the other diversifiers in the 60/40 debate and portfolio hedging.
Frequently asked questions
Do rising real yields always push gold down?
No. Across 284 months, the correlation between the monthly change in the 10-year real yield and the monthly change in gold is −0.45, and R² is about 0.20. The direction is right more often than not, but three-quarters or more of gold’s monthly variance comes from other things.
Has the relationship between gold and real yields broken?
Not month to month. The correlation was −0.41 from 2022 to September 2026, close to the −0.49 of 2003–2021. What failed is the cumulative prediction: real yields rose 3.87 points and the old line implied a 13% fall, while gold rose 136%.
Why did gold rise while real yields rose?
The data here cannot say. The World Gold Council points to central-bank buying that has stayed at very high levels for four years, and it reports ETF holders selling when rates expectations rose. Our reading, that price-insensitive buying lifted the level while rate-sensitive investors still drive the monthly moves, is a hypothesis.
Did gold protect investors in stock bear markets?
In two of the four bear markets since 2000. Gold rose 15.4% while the S&P 500 fell 48.9% in 2000–2002 and rose 24.5% while it fell 56.8% in 2007–2009. In the 2020 crash it fell 2.5% and in the 2022 bear market, when real yields rose 2.6 points, it fell 6.8%.
How volatile is gold?
More than its reputation suggests. Since November 2004, 32 of about 5,500 GLD sessions fell 3.9% or more, and two of its five worst days came in the twelve months to September 2026: −10.3% on 30 January 2026 and −6.4% on 21 October 2025.
Can this analysis tell me whether to buy gold?
No. It describes what a relationship did in the past and where it stopped explaining. It contains no forecast, and AssetWhisper does not publish trade signals or recommendations.
How we calculated this
- Gold: COMEX front-month futures (Yahoo Finance ticker GC=F), daily, from 30 August 2000; month-end values for the regressions. A continuous futures series has roll gaps between contracts, so we repeated the main test with the GLD ETF, which does not, and the conclusion held.
- Real yield: 10-year Treasury inflation-indexed constant-maturity yield, FRED series DFII10, from 2 January 2003 to 25 September 2026. Its latest value on the day of the analysis (29 September) was the 25th, so the September month is a partial month for both series.
- Fit: ordinary least squares of the monthly log change in gold on the monthly change in the real yield, January 2003 to December 2021 (227 months). Out-of-sample: the same slope and intercept applied to the 57 actual changes from January 2022 to September 2026. Out-of-sample R² = 1 − SSE / SST around the period’s own mean.
- Equity bear markets: S&P 500 closing prices between the peak and trough dates stated; gold measured over the same closes.
- Limits: a linear one-variable model over 227 and 57 monthly observations; correlations, not causes; nominal dollar prices; no transaction costs or fund fees (GLD’s fee is about 0.4% a year). The script that prints every figure is published alongside this article’s working files.
Sources
- Federal Reserve Bank of St. Louis, FRED: Market Yield on U.S. Treasury Securities at 10-Year Constant Maturity, Inflation-Indexed (DFII10).
- Yahoo Finance: COMEX gold futures (GC=F), SPDR Gold Shares (GLD) and S&P 500 (^GSPC) daily closes.
- World Gold Council, Gold Demand Trends: Q2 2026, 30 July 2026 (central-bank purchases, ETF flows, jewellery demand, LBMA average price).
Related reading
- Gold price outlook, May 2026 — the central-bank and de-dollarisation case behind the level.
- Bear markets since 1950 — the four declines used here, in depth and duration.
- Equity risk premium and real yields — why the same rate is now the price of everything.
- Why bond yields rise when central banks cut — the nominal-versus-real decomposition.
This article is general information, not personalised investment advice. It does not take into account the financial situation, objectives, tax position or risk tolerance of any individual reader, and the same text is distributed to all readers. Historical statistical relationships describe the past under stated assumptions and are not forecasts; prices and yields quoted describe the dates stated and change continuously. Capital is at risk.