Active ETFs vs Index Funds: What the After-Fee Record Shows
Key takeaway
We tested the 35 largest active ETFs against the index ETF in their own category: 21 of 33 were ahead over three years, but only 1 of 6 in US large blend, and switching to another reasonable benchmark reversed 4 of 15 verdicts. Active ETFs beat active mutual funds mainly by charging less.
If a financial adviser keeps recommending active ETFs, the question behind the recommendation is an old one in a new wrapper: will a manager who picks the holdings beat an index fund that simply owns them, once both have paid their costs? The wrapper does change some things. It cuts fees and, in the US, it nearly eliminates capital-gains distributions. What it cannot change is the arithmetic that makes active management, taken as a whole, trail the market after costs.
We checked the record three ways: Morningstar’s latest comparisons of active and passive funds, the expense data, and our own test of the 35 largest active ETFs we could find in core categories against the index ETF in the same category, to 5 November 2026.
- Active ETFs have done better than active mutual funds, and mostly because they are cheaper. Over the three years to December 2025, 50% of active ETFs beat their average passive peer, against 41% of active mutual funds; before fees, the ETFs’ edge largely disappeared.
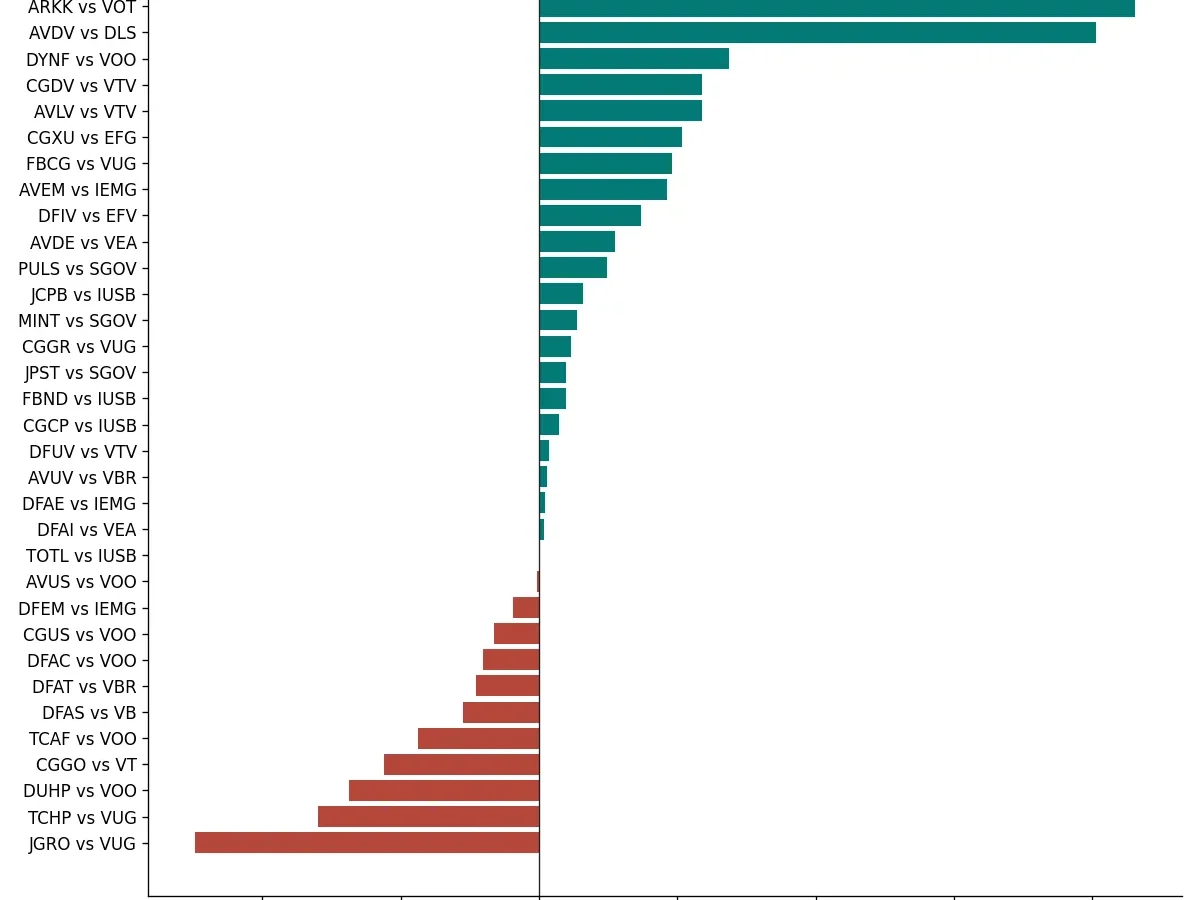
- The largest active ETFs did beat their index ETF more often than not: 21 of 33 over three years, by a median 0.29 points a year. That sample flatters them, because it was chosen by today’s size.
- Where an adviser’s alternative is an S&P 500 fund, the record is weakest: 1 of the 6 large-blend active ETFs with three years of history beat Vanguard’s S&P 500 ETF.
- The verdict depends on the index you pick. Swapping one reasonable benchmark for another reversed the result for 4 of the 15 funds we checked twice.
None of this is a view on any fund. The funds below are named so the numbers can be checked, not recommended.
The short answer, in one table
| Source | What it measures | Result |
|---|---|---|
| Morningstar Active/Passive Barometer, mid-2026 | Active mutual funds and ETFs that survived and beat their average passive peer, 12 months to June 2026 | Just over 40%; 36% in US equity |
| Same report, 10 years | US large-growth active funds that survived and beat passive peers | 5% |
| Morningstar, active ETFs vs active mutual funds (March 2026) | Three-year success rate against passive peers, to December 2025 | 50% for active ETFs, 41% for active mutual funds |
| SPIVA U.S. Scorecard, mid-2026 | US large-cap active funds trailing the S&P 500 over 20 years, net of fees | 92.6% |
| Our test, 3 years to 5 Nov 2026 | Largest active ETFs ahead of the index ETF in their category | 21 of 33; in US large blend, 1 of 6 |
The first four rows measure the whole field, including funds that closed. The last measures the biggest survivors, which is the field most investors are actually shown. Both are true, and the gap between them is most of what this article is about.
What an active ETF is, and what the wrapper changes
An active ETF is a fund whose holdings are chosen by a manager or a rule of the manager’s own, rather than by an external index, and whose shares trade on an exchange. That covers very different things: stock pickers such as Capital Group or T. Rowe Price, systematic funds that tilt towards cheap, small or profitable companies such as Dimensional and Avantis, quantitative funds that rotate between factors, and option-income or “buffer” funds that are active mainly because they trade derivatives.
The category exploded after the SEC’s ETF Rule of 2019 made launches cheaper and gave managers more flexibility. Morningstar counts nearly 3,000 active ETFs launched since the start of 2020; of the 1,131 ETFs launched in 2025, 950 were actively managed. Many of the newest are niche or leveraged products, and Morningstar finds that new launches tend to be expensive while cheap ones are increasingly rare.
The wrapper changes three things, and only the first two help investors:
- Fees. Morningstar found active ETFs charged on average 37 basis points (0.37 percentage points) less than active mutual funds. For all active US equity funds, the asset-weighted expense ratio was 0.58% in 2025; index equity mutual funds charged 0.05%, according to the Investment Company Institute, and the largest S&P 500 ETFs charge 0.03%.
- Taxes, for US taxable accounts. ETFs can hand appreciated shares to market makers instead of selling them, so few distribute capital gains. In 2025, 9% of active ETFs paid a capital-gains distribution, against 53% of active mutual funds, according to State Street (itself an ETF issuer); 4% of index ETFs did. The advantage is about when tax is paid, not whether.
- Trading. An ETF can be bought and sold all day. That is a cost for anyone tempted to trade it, and the measured cost of that temptation is in what behavioural biases actually cost.
The most useful single fact from Morningstar’s comparison is what happened before fees. Ranked on gross returns, active ETFs beat active mutual funds in only 10 of 19 categories, close to a coin toss. Their edge over mutual funds was, in the main, that they charged less. That is a good reason to prefer an active ETF to the same manager’s mutual fund. It is not, by itself, a reason to prefer it to an index fund.
Our test: the 35 largest active ETFs against the index ETF in the same category
We took the largest actively managed ETFs we could find in each core Morningstar category, US and international stocks and taxable bonds, $706 billion of assets between them, and paired each with the largest low-cost index ETF in the same category: Vanguard’s S&P 500 ETF (VOO) for large blend, Vanguard’s growth and value ETFs for large growth and value, and so on. Returns are total returns with distributions reinvested, net of each fund’s own fees, to the close of 5 November 2026. Thirty-three had three full years of trading.
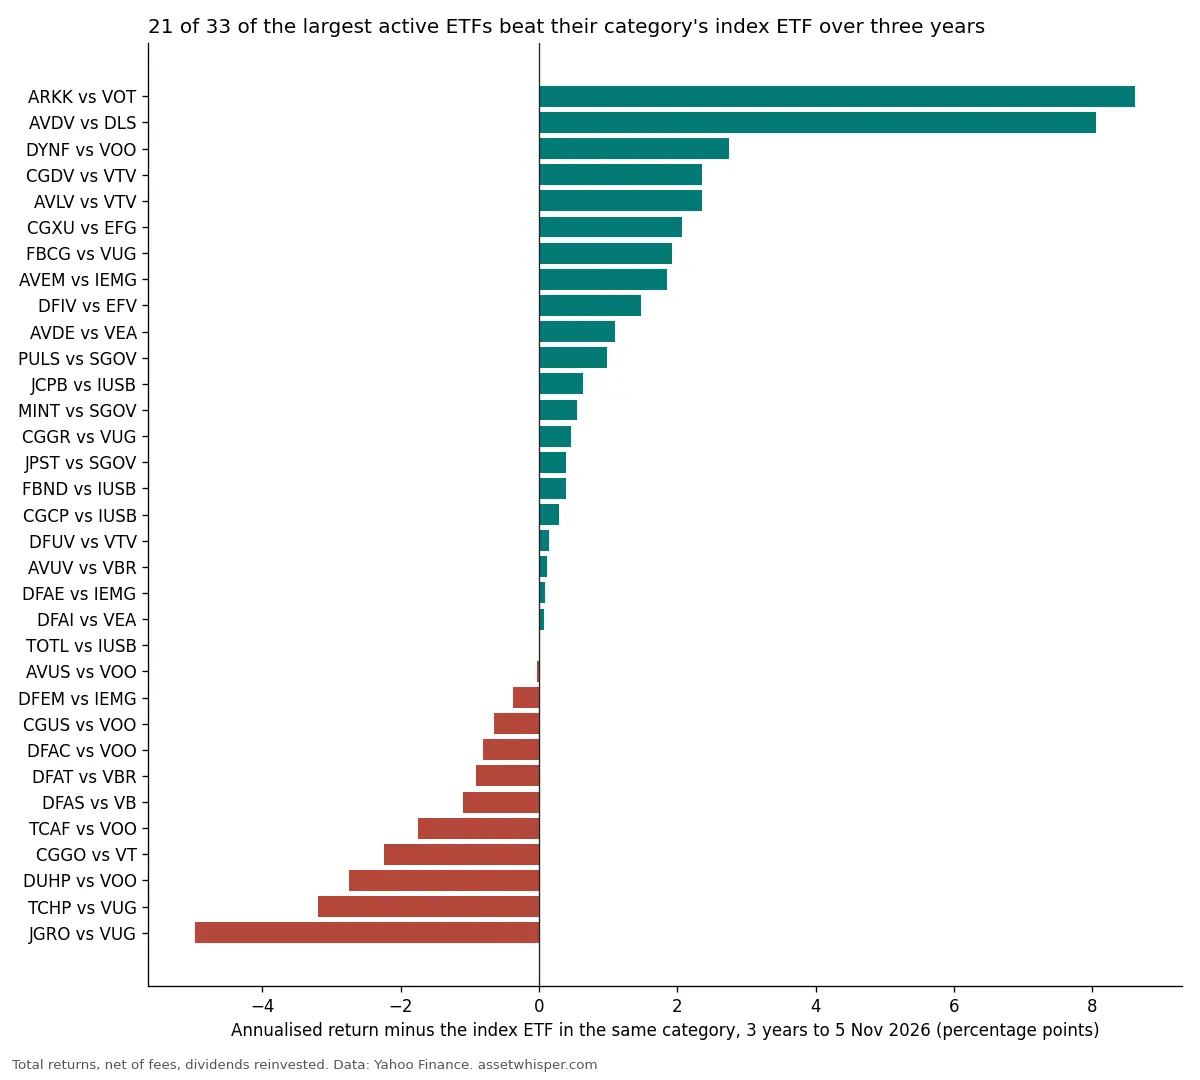
| Category (index ETF, 3-year return) | Active ETF, 3-year return and gap | Ahead |
|---|---|---|
| US large blend (VOO, 20.51% a year) | DYNF 23.25% (+2.75) · AVUS 20.48% (−0.03) · CGUS 19.86% (−0.65) · DFAC 19.70% (−0.81) · TCAF 18.76% (−1.74) · DUHP 17.76% (−2.75) | 1 of 6 |
| US large value (VTV, 20.13%) | CGDV 22.50% (+2.36) · AVLV 22.49% (+2.36) · DFUV 20.27% (+0.14) | 3 of 3 |
| US large growth (VUG, 20.78%) | FBCG 22.71% (+1.92) · CGGR 21.25% (+0.46) · TCHP 17.59% (−3.20) · JGRO 15.81% (−4.97) | 2 of 4 |
| US small value and blend (VBR 17.65%, VB 16.95%) | AVUV 17.77% (+0.11) · DFAT 16.74% (−0.91) · DFAS 15.85% (−1.10) | 1 of 3 |
| US mid-cap growth (VOT, 13.92%) | ARKK 22.54% (+8.62) | 1 of 1 |
| Foreign developed (VEA, EFV, DLS, EFG, VT) | AVDV +8.06 · CGXU +2.07 · DFIV +1.48 · AVDE +1.10 · DFAI +0.07 · CGGO −2.25 | 5 of 6 |
| Emerging markets (IEMG, 16.71%) | AVEM 18.56% (+1.85) · DFAE 16.81% (+0.09) · DFEM 16.34% (−0.37) | 2 of 3 |
| Core-plus bonds (IUSB, 5.10%) | JCPB 5.74% (+0.64) · FBND 5.49% (+0.39) · CGCP 5.39% (+0.29) · TOTL 5.10% (level) | 3 of 4 |
| Ultrashort bonds (SGOV, 4.27%) | PULS 5.25% (+0.98) · MINT 4.82% (+0.55) · JPST 4.66% (+0.39) | 3 of 3 |
| All 33 | Median gap +0.29 points a year; asset-weighted +0.58 | 21 of 33 |
Gaps are annualised percentage points over the three years to 5 November 2026. Expense ratios in the sample average 0.28% weighted by assets, against 0.07% for the paired index ETFs (medians 0.31% and 0.03%).
Taken at face value, this is a better record than the industry-wide numbers, and better than 25 years of SPIVA scorecards would lead anyone to expect. Over one year, 24 of 35 were ahead; over five years, 16 of the 22 old enough. The bond funds did well, as Morningstar’s figures for active bond funds would predict. Before reading anything into it, though, the test has four weaknesses, and each pushes in the same direction.
Why the test flatters active ETFs
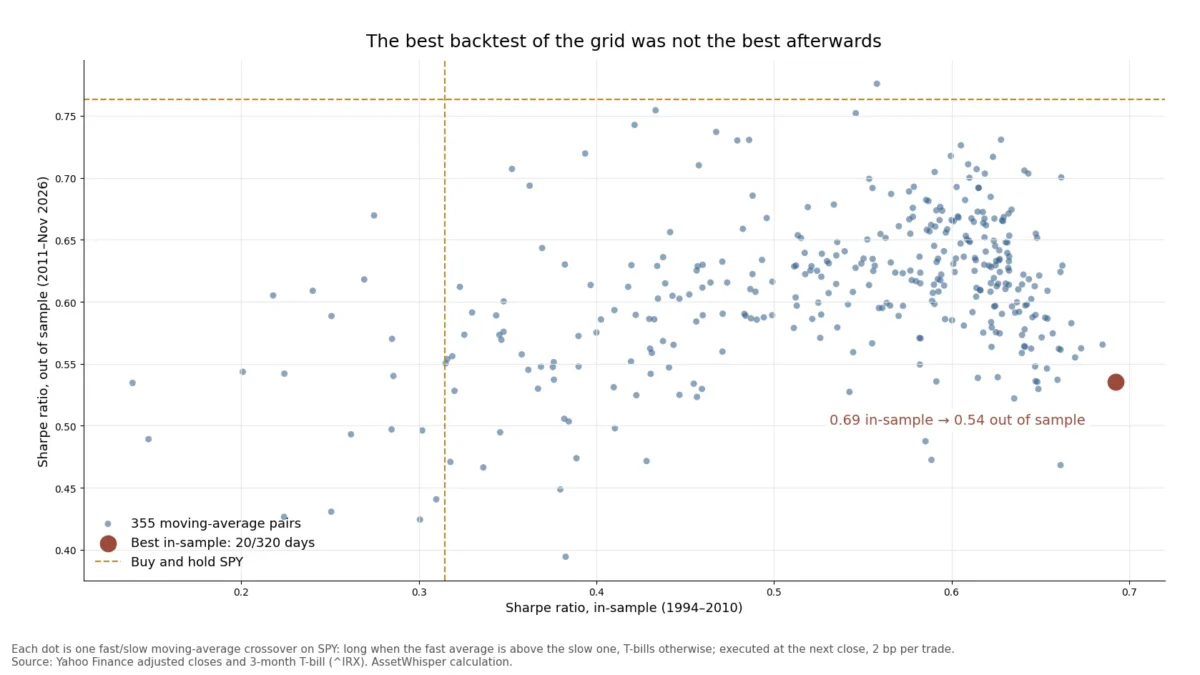
1. It is a list of survivors, chosen by size. A fund is large today partly because it did well, and money followed. Funds that lagged, shrank or closed are not on the list, which is exactly the survivorship bias we measured in how to read a backtest. The scale of it is visible in SPIVA’s data for US large-cap funds: of 690 that existed in mid-2006, 438 had been closed or merged by mid-2026. A list of today’s biggest active ETFs is the equivalent of looking only at the 252 that remained.
2. The benchmark decides more than the manager. Index families disagree about what a category contains. FTSE, whose indexes Vanguard uses, counts South Korea as a developed market; MSCI, used by iShares and by most active managers, counts it as emerging. Over the three years to November, iShares’ South Korea ETF returned 31.2% a year. Vanguard’s emerging-markets ETF, which leaves Korea out, returned 14.21% a year; iShares’ MSCI version, which includes it, 16.71%. That is a 2.5-point annual gap between two index funds in the same category, before any manager has made a decision. We reran 15 of the funds against a second reasonable index ETF:
| Active ETF | Gap vs first index ETF | Gap vs second index ETF |
|---|---|---|
| DFEM, emerging markets | −0.37 (IEMG) | +2.13 (VWO) |
| DFAE, emerging markets | +0.09 (IEMG) | +2.59 (VWO) |
| AVDV, foreign small value | +8.06 (DLS) | +2.80 (ISVL) |
| DFAI, foreign large blend | +0.07 (VEA) | +1.48 (IEFA) |
| DFAT, US small value | −0.91 (VBR) | +0.89 (IJS) |
| DFAS, US small blend | −1.10 (VB) | +0.26 (IJR) |
| AVUV, US small value | +0.11 (VBR) | +1.92 (IJS) |
| AVUS, US large blend | −0.03 (VOO) | +0.23 (VTI) |
| DFAC, US large blend | −0.81 (VOO) | −0.55 (VTI) |
Four of the 15 changed from behind to ahead (DFEM, DFAT, DFAS and AVUS), and the gap moved by more than a point for several others; the full list is in the calculation output. When an active fund reports that it beat “its benchmark”, the first question is which one, and who chose it.
3. Much of the outperformance is a factor tilt, not stock picking. Nine of the 13 equity winners outside large growth come from Dimensional and Avantis, whose funds systematically overweight cheaper, smaller and more profitable companies. Those tilts paid in the period, especially abroad: the largest gap in the table, Avantis International Small Cap Value at 8.06 points a year ahead, mostly reflects the strength of small value stocks outside the US. An index fund of exactly those stocks, iShares’ ISVL, returned 23.30% a year, and against it the gap shrinks from 8.06 points to 2.80. The same tilts are available in index funds, and their long-run record is the subject of does momentum investing work? and do high-dividend stocks beat the market? Paying an active fee for a factor is a choice worth making knowingly.
4. Three years is short, and the answer moves with the window. Capital Group Dividend Value was 2.36 points a year ahead of Vanguard’s value ETF over three years and 10.45 points behind it over the last twelve months. ARK Innovation was 8.62 points a year ahead of its mid-cap growth index over three years and 11.34 points a year behind over five. Morningstar’s own caveat about its active-ETF figures applies here: these are small samples that bear monitoring.
Where the record is weakest: large US stocks
The category where an adviser’s recommendation most often competes with a plain S&P 500 fund is US large blend, and there the result is lopsided. One of six active ETFs with three years of history, BlackRock’s factor-rotation fund, beat VOO; the other five trailed by between 0.03 and 2.75 points a year. Part of that is that several of them hold smaller companies than the S&P 500 during years when the largest stocks led, which is a tilt, not a failure of selection; against the total-market ETF (VTI) the gaps narrow by about a quarter of a point, and four of the six stay negative.
Large growth tells the same story over a longer horizon. Two of four active growth ETFs beat VUG over three years, but in Morningstar’s 10-year figures to June 2026 only 5% of active US large-growth funds survived and beat their passive peers, and the losers’ shortfalls were far larger than the winners’ gains. This is the market SPIVA covers most thoroughly, and where 92.6% of active large-cap funds trailed the S&P 500 over 20 years.
Option-income and buffer ETFs: income is not return
Several of the largest active ETFs are not stock pickers at all. They hold an index, or something close to it, and sell call options on it, turning part of the future upside into a monthly distribution. Their yields are the selling point: 6.9% for JPMorgan Equity Premium Income (JEPI) over the last twelve months and 10.9% for its Nasdaq sibling, against 1.1% for VOO. A distribution, though, is part of the return, not an addition to it.
The fair comparison is not with the full index, which takes more risk, but with a mix of the index and Treasury bills that carries the same market exposure (beta) as the fund. Since each fund launched:
| ETF (launched, fee) | Return a year | Index | Same-beta mix of index and T-bills | Passive covered-call ETF |
|---|---|---|---|---|
| JEPI (May 2020, 0.35%) | 10.74% | VOO 16.84% | 10.66% (beta 0.55) | XYLD 10.59% |
| BUFR, buffer ladder (Aug 2020, 0.95%) | 10.24% | VOO 15.14% | 10.12% (beta 0.59) | — |
| JEPQ (May 2022, 0.35%) | 12.63% | QQQ 16.85% | 14.68% (beta 0.72) | QYLD 8.48% |
| SPYI (Aug 2022, 0.68%) | 13.60% | VOO 17.36% | 14.74% (beta 0.78) | XYLD 10.49% |
| GPIX (Oct 2023, 0.29%) | 19.98% | VOO 22.67% | 20.36% (beta 0.90) | XYLD 13.74% |
| QQQI (Jan 2024, 0.68%) | 14.41% | QQQ 16.99% | 15.69% (beta 0.82) | QYLD 10.98% |
All five with a passive covered-call counterpart beat it; those older funds sell options mechanically on the whole index. Against the same-beta mix, two (JEPI and BUFR) roughly matched it and four trailed by 0.4 to 2.1 points a year. In other words, the largest of these funds delivered about what their lower stock exposure would predict, and the high yield was the upside they sold, paid out in advance. A same-beta mix is a rough yardstick for an option strategy, whose payoff is not linear, but it is the right order of comparison. The costs of the buyer’s side of the same trade are in portfolio hedging strategies and what each one costs.
For US investors in taxable accounts there is one more line to read: how the distribution is taxed. Option premium and income from the notes some of these funds use are generally not qualified dividends. The fund’s annual tax-character statement shows the split.
The fee arithmetic: what an active ETF has to beat
An active fund does not have to beat the index; it has to beat the index fund, after both have charged. On $100,000 invested for 20 years at 7% a year before fees, with the fee taken off each year’s return:
| Expense ratio | Typical of | After 20 years | Less than at 0.03% | Required edge before fees, every year |
|---|---|---|---|---|
| 0.03% | Largest S&P 500 ETFs | $384,804 | — | — |
| 0.18% | Low-cost systematic active ETFs | $374,155 | $10,649 | 0.15 points |
| 0.33% | Median of our active sample (0.31%) | $363,786 | $21,018 | 0.30 points |
| 0.58% | Active US equity funds, asset-weighted, 2025 | $347,108 | $37,696 | 0.55 points |
| 1.00% | Equal-weighted average active US equity fund | $320,714 | $64,091 | 0.97 points |
The 7% is an illustration, not a forecast; the gap scales with whatever return the market delivers. An adviser’s own fee, if there is one, is charged on top of either fund and does not change the comparison between them. The mechanism is the same one described in why active funds trail: active investors as a group hold the market, so as a group they earn its return before costs and less after them. Low-cost active ETFs have narrowed the hurdle; they have not removed it.
Questions worth asking when an active ETF is recommended
None of these has a right answer in the abstract, and none is advice about any fund. They are the questions the data above says matter:
- Against which index is the fund measured, and what does the index ETF in the same Morningstar category cost? The difference in fees is the hurdle, every year.
- How long is the ETF’s own record, after fees? A mutual fund’s longer history under a different fee structure is a different record. Three years is short.
- How much of the past outperformance is a factor tilt (value, size, profitability, momentum) that an index fund also offers, and at what price?
- If the fund pays a high yield, what is its total return against a mix of the index and cash with the same risk? And how is the distribution taxed in your account?
- What happened to the manager’s funds that are no longer offered? The surviving lineup is the best-looking version of the record.
- How is the adviser paid, and does the recommendation come from a model portfolio built by the fund’s sponsor? That is not a reason to reject it, but it is part of the information.
Frequently asked questions
Are active ETFs better than index funds?
On the evidence so far, not as a group. Active ETFs have beaten active mutual funds, mainly because they charge less, and the largest ones have done well in the last three to five years, helped by factor tilts and by the fact that they are, by definition, the survivors. Across the whole field, Morningstar finds most active funds still trail passive peers, and the long-run record in US large-cap stocks is poor.
Are active ETFs more tax-efficient than index funds?
Not usually more than index ETFs, which are the most tax-efficient funds in the US: 4% of them paid a capital-gains distribution in 2025, against 9% of active ETFs. Both are far more tax-efficient than active mutual funds, 53% of which paid one. For investors outside the US, or inside tax-sheltered accounts, the point mostly does not apply.
Why are so many active ETFs being launched?
Because they are easier to launch since 2019 and pay their sponsors better. Of 1,131 ETFs launched in 2025, 950 were active, and Morningstar notes that new launches are getting more expensive and that many test niches the largest index providers do not serve. Launch numbers measure what sells, not what works.
Methodology
- Prices and fund data: Yahoo Finance via yfinance, dividend-adjusted closes, retrieved 6 November 2026; last close 5 November 2026. Assets, net expense ratios and Morningstar categories as reported by Yahoo Finance on the same date.
- Sample: 35 actively managed ETFs, the largest we could identify in core US and international equity, core-plus and ultrashort bond categories, plus six option-income and buffer ETFs analysed separately. Leveraged, single-stock, crypto, CLO and multisector funds were left out because they have no clean index counterpart. Sample selection by current size is a deliberate best case for active funds.
- Pairs: each active ETF against the largest low-cost index ETF in its Morningstar category (VOO, VTV, VUG, VBR, VB, VOT, VEA, EFV, DLS, EFG, VT, IEMG, IUSB, SGOV), with a second index ETF for 15 funds (VWO, IEFA, IJR, IJS, ISVL and VTI) where index families or styles differ.
- Returns: annualised total returns over identical windows for both funds; “since launch” starts at the later of the two funds’ first trading days.
- Option-income comparison: beta of daily returns against the index since launch; the same-beta mix holds that fraction in the index and the rest in 1–3 month T-bills (BIL), rebalanced daily, before any costs of its own.
- Fee table: the expense ratio subtracted from a 7% annual return, compounded for 20 years.
- The calculation script and its output, kept with the article, reproduce every figure.
Sources
- Brian Paoli, “Active Fund Manager Success Rates Ticked Up in 2026, but Passive Funds Still Hold the Advantage”, Morningstar, 6 August 2026 — the midyear 2026 US Active/Passive Barometer (9,226 funds, data to June 2026).
- Bryan Armour, “ETFs Improve Odds of Success for Active Managers”, Morningstar, 27 March 2026 — three-year success rates of active ETFs and mutual funds, fees and gross-return comparison, data to 31 December 2025.
- Zachary Evens, “How Active ETFs Are Reshaping Fund Fees”, Morningstar, 19 May 2026 — from the 2026 US Fund Fee Study: asset-weighted fees and 2025 launches.
- State Street Global Advisors, “Tax efficiency is structural: ETFs continue to issue fewer capital gains than mutual funds” — share of active and passive ETFs and mutual funds distributing capital gains in 2025.
- S&P Dow Jones Indices, SPIVA U.S. Scorecard Mid-Year 2026, and Investment Company Institute, 2026 Investment Company Fact Book, as summarised in our SPIVA article.
- Prices and fund data: Yahoo Finance via yfinance, retrieved 6 November 2026.
Related reading
- Index funds vs active management — what 25 years of SPIVA scorecards show, and whether winners can be picked in advance.
- How to read a backtest without fooling yourself — survivorship bias, measured.
- How often do index funds rebalance? — turnover inside the funds on the other side of this comparison.
- Portfolio hedging strategies and what each one costs — the buyer’s side of the option trade.
- Do high-dividend stocks beat the market? — the factor behind several of the winners.
This article is general information, not personalised investment advice. It does not take into account the financial situation, objectives or risk tolerance of any individual reader, and the same text is distributed to all readers. Funds are named to identify the data, not as recommendations to buy, hold or sell them. Past performance does not indicate future results, and capital is at risk.