The AI Stock Sell-Off of November 2026: What Fell, Why, and What Past Nasdaq Falls Show
Key takeaway
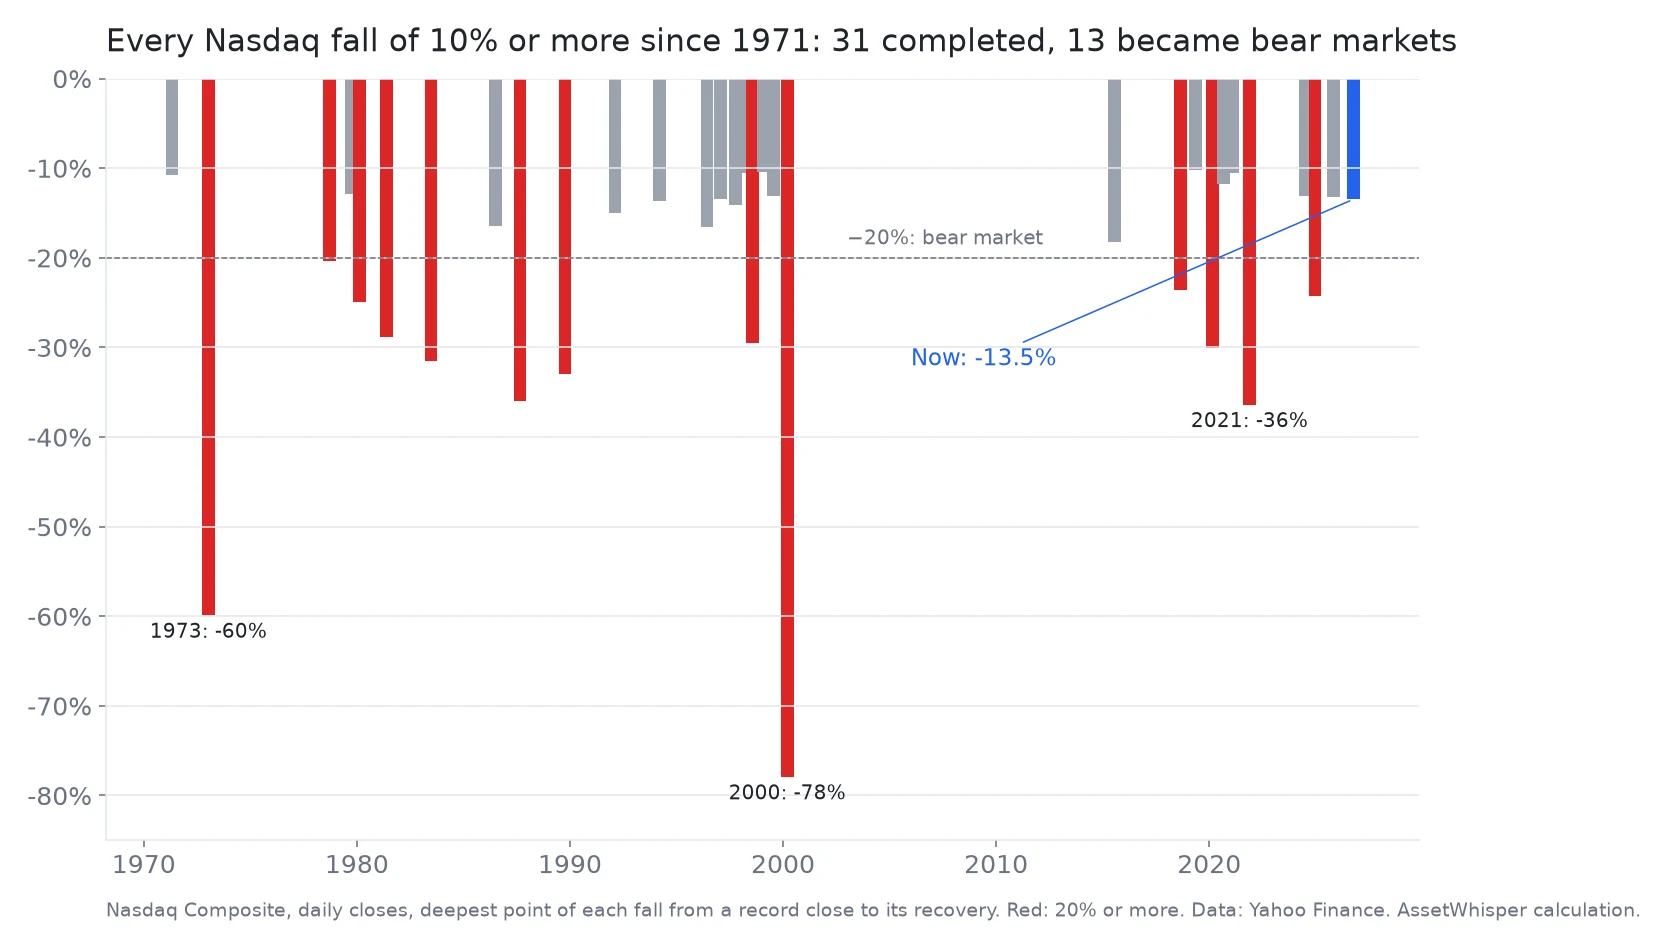
To the close of 19 November, the Nasdaq was 13.5% below its record and Nvidia 39% below its high, but the equal-weighted S&P 500 had lost only 0.3% since 6 October. The fall is concentrated in AI stocks, after a debt scare, the midterms, Nvidia's CEO exit and Fed hike bets. Of 19 past Nasdaq falls this deep, 13 reached 20%.
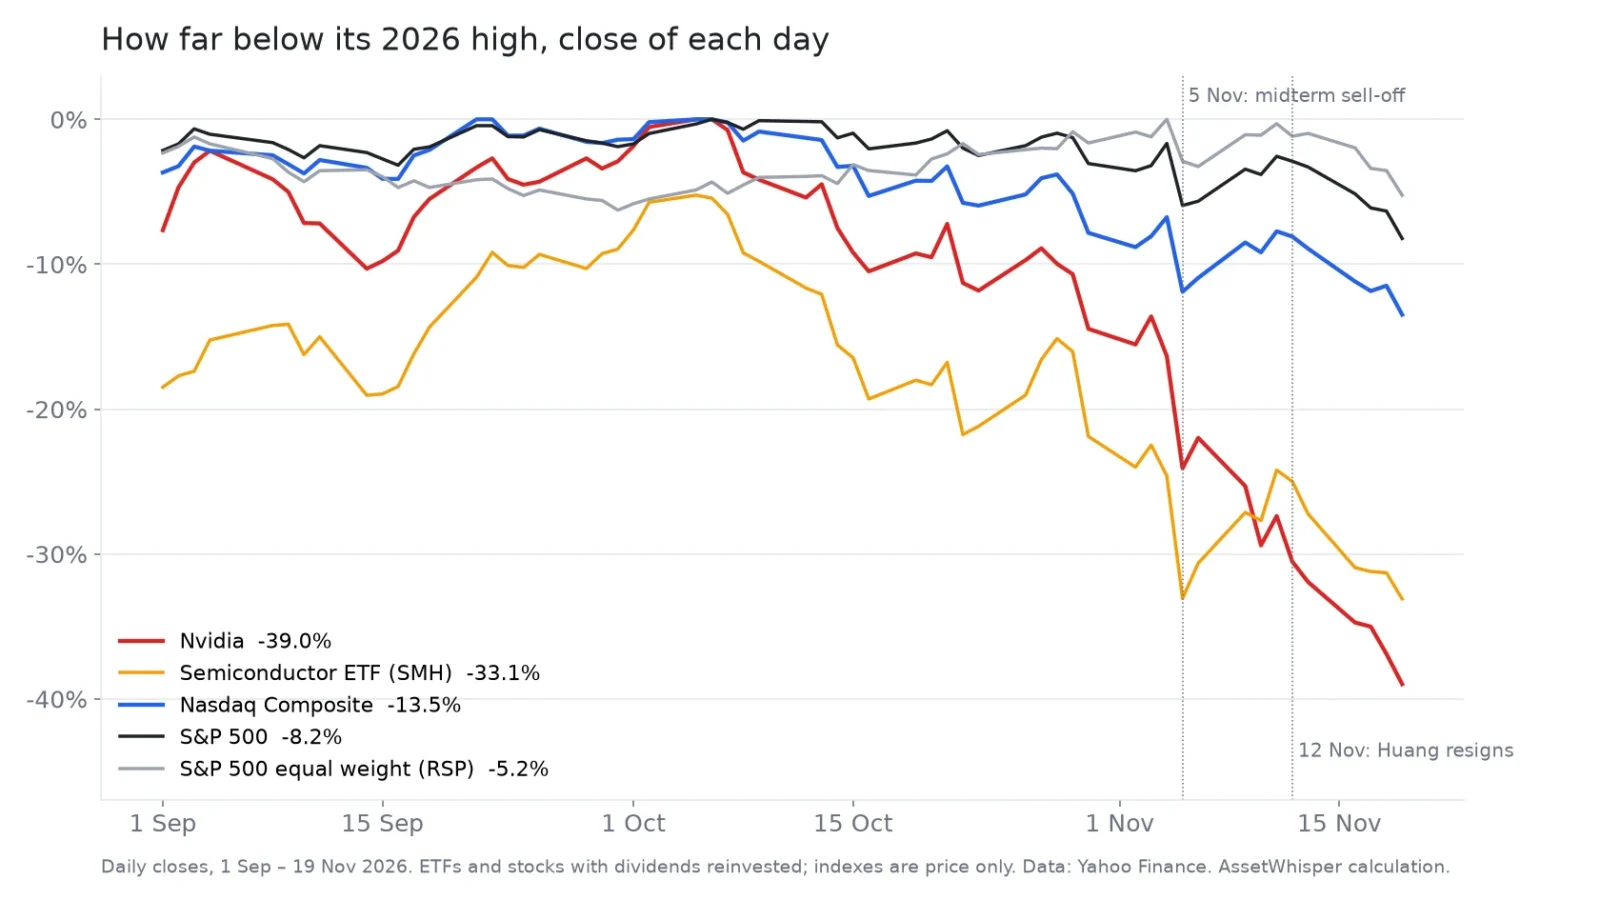
The Nasdaq Composite closed on Thursday 19 November 13.5% below its record of 6 October, and the S&P 500 8.2% below its own. That sounds like a broad market fall. It is not. Over the same six weeks, the equal-weighted S&P 500, in which every company counts the same, is down 0.3%. Six of the eleven sectors are up. The fall is concentrated in the companies tied to artificial intelligence: twelve of the largest AI-linked stocks, held in equal amounts, are down 22.9%, and Nvidia is down 39.0% from its high.
This article sets out what has fallen and by how much, the events reported as causes, and what the record of past Nasdaq declines says about falls of this size. Every market figure is a close-to-close calculation from public data, with the script listed at the end. Nothing here is a buy or sell signal or a forecast.
Status: figures to the close of Thursday 19 November 2026.
- A fall in one part of the market. Since 6 October, the S&P 500 ETF has returned −8.1% and the equal-weight S&P 500 ETF −0.3%. The technology sector fund fell 20.5% while consumer staples rose 9.9%.
- Four things hit AI stocks within five weeks. Credit markets started charging more to lend to companies building data centres. Democratic gains in the 3 November elections raised the prospect of limits on new data centres. Nvidia lost its chief executive. And traders came to expect a Federal Reserve rate increase in December.
- Nvidia’s results did not stop the fall. The company reported $115.8 billion of quarterly revenue on 17 November, above estimates, and its shares fell 2.9% and 3.3% on the next two days.
- History gives no comfort either way. Since 1971 the Nasdaq has had 19 completed declines that went at least as deep as this one: 13 went on to 20% or more, and 6 recovered without getting there.
What has fallen, and by how much
| Close of 19 Nov 2026 | Close | 2026 closing high | From the high | Since 6 Oct | 2026 so far |
|---|---|---|---|---|---|
| S&P 500 | 7,175.83 | 7,818.93 (6 Oct) | −8.2% | −8.2% | +4.8% |
| Nasdaq Composite | 23,879.20 | 27,599.79 (6 Oct) | −13.5% | −13.5% | +2.7% |
| Nasdaq-100 | 26,517.05 | 31,224.47 (6 Oct) | −15.1% | −15.1% | +5.0% |
| Dow Jones Industrial Average | 49,097.06 | 54,349.12 (5 Aug) | −9.7% | −4.7% | +2.2% |
| Russell 2000 | 2,655.11 | 3,068.42 (14 Aug) | −13.5% | −6.2% | +7.0% |
| S&P 500 equal weight (RSP) | $211.63 | $223.33 (4 Nov) | −5.2% | −0.3% | +11.8% |
| Semiconductor ETF (SMH) | $447.48 | $668.91 (22 Jun) | −33.1% | −29.3% | +24.3% |
| Software ETF (IGV) | $96.10 | $112.67 (9 Oct) | −14.7% | −13.6% | −9.1% |
Indexes are price only; the ETFs include dividends. The VIX, the market’s measure of expected volatility, closed at 28.44, against 15.01 on 6 October. The S&P 500 has fallen for six sessions in a row, its longest losing streak since 2024 (AP). Data: Yahoo Finance. AssetWhisper calculation.
The AI-linked companies one by one, from each one’s own 2026 closing high:
| Company | Close, 19 Nov | From its 2026 high | Since 6 Oct | 2026 so far |
|---|---|---|---|---|
| CoreWeave (CRWV) | $44.91 | −67.5% (6 May) | −51.0% | −37.3% |
| Oracle (ORCL) | $110.57 | −55.1% (1 Jun) | −23.3% | −42.5% |
| Micron (MU) | $690.44 | −43.1% (25 Jun) | −34.0% | +142.1% |
| Nvidia (NVDA) | $145.98 | −39.0% (6 Oct) | −39.0% | −21.5% |
| Alphabet (GOOGL) | $272.66 | −32.2% (13 May) | −21.6% | −12.7% |
| Broadcom (AVGO) | $346.65 | −27.8% (2 Jun) | −7.8% | +0.7% |
| TSMC (TSM) | $352.09 | −27.5% (5 Oct) | −27.0% | +16.8% |
| Palantir (PLTR) | $153.68 | −26.5% (9 Oct) | −20.0% | −13.5% |
| AMD | $489.19 | −24.7% (6 Oct) | −24.7% | +128.4% |
| Meta (META) | $596.22 | −23.3% (24 Sep) | −19.3% | −9.4% |
| Microsoft (MSFT) | $498.30 | −10.2% (4 Nov) | −5.7% | +3.9% |
| Amazon (AMZN) | $257.37 | −9.4% (3 Aug) | +0.4% | +11.5% |
Ten of the twelve are 20% or more below their 2026 high; the median is −27.7%. Held in equal amounts, the twelve fell 22.9% from 6 October, and are still up 7.1% in 2026. Half of them are still up on the year, two of them by more than 100%. A fall from a high this year is not the same as a loss for everyone who held the stock in January.
The fall is in the largest companies, not in the average stock
An index weighted by market value moves with its largest members, and in 2026 the largest members of the S&P 500 are the AI companies. The gap between the two ways of weighting the same 500 companies is the clearest measure of how narrow this fall is:
| Total return, 6 Oct to 19 Nov 2026 | Change |
|---|---|
| Technology (XLK) | −20.5% |
| Communication services (XLC) | −8.0% |
| Industrials (XLI) | −6.0% |
| Energy (XLE) | −4.5% |
| Materials (XLB) | −0.6% |
| Financials (XLF) | +2.9% |
| Consumer discretionary (XLY) | +3.7% |
| Real estate (XLRE) | +4.3% |
| Utilities (XLU) | +4.5% |
| Health care (XLV) | +6.2% |
| Consumer staples (XLP) | +9.9% |
| S&P 500, weighted by market value (SPY) | −8.1% |
| S&P 500, equal weight (RSP) | −0.3% |
Long-dated Treasuries (TLT) returned +4.4% over the same period. Gold (GLD) fell 12.3%, so it did not act as a hedge this time.
For an investor in a market-weighted index fund, this cuts both ways. The same concentration that lifted the index in the AI rally is what is pulling it down now; how much of an S&P 500 fund sits in a handful of names, and what that does to diversification, is in how much risk diversification removes.
What has been reported as the cause
No single event explains six weeks of selling, and markets do not publish their reasons. What follows are the four developments that news reports tied to the fall, in the order they arrived, with the market move on the day where there is one.
1. The cost of financing the build-out (October)
The selling in AI stocks began before the elections, on the question of who pays for the data centres. The companies building them have increasingly borrowed to do it, and in October the credit market started charging more:
- CoreWeave, which rents out Nvidia chips, has a 9.75% bond due 2031 that was yielding close to 16% by 18 November, and its five-year credit default swaps, the cost of insuring its debt against default, traded between 1,100 and 1,200 basis points. CNBC notes that spreads above 1,000 are generally read as a sign of distress (CNBC).
- The cost of insuring Oracle’s debt rose over the past year from below 80 basis points to above 300, and default swaps on the largest technology companies, including Amazon and Meta, more than doubled and hit five-year highs earlier in November (CNBC).
The two stocks most exposed to that debt are the two that have fallen most: CoreWeave 67.5% from its high and Oracle 55.1%. The semiconductor ETF had two days of −6.0% and −7.0% in October, on 22 and 30 October, before any election result.
2. The midterm elections (5 November)
On Thursday 5 November, two days after the elections, the S&P 500 fell 4.4%, its worst day since the April 2025 tariff sell-off, and the Nasdaq fell 5.5%. Nvidia lost 9.3%, AMD 17.3% and CoreWeave 9.8%. The Associated Press reported that the selling was led by stocks tied to the data-centre build-out and that the “nationwide victories for Democrats raised the possibility” of forced pauses in construction (AP).
The local vote on data centres was one-sided. Voters decided 41 local ballot measures on data centres in 10 states, 21 of them in Ohio, and sided against the data centre in every one except one, in Harwood, North Dakota (CNBC, citing Ballotpedia). A national moratorium is a proposal, not a law; the new Congress sits in January.
3. Nvidia without Jensen Huang (12–19 November)
Nvidia’s founder resigned as chief executive on 12 November after weeks of reporting about his private life and its possible security implications, which we set out in Nvidia and key-person risk. On 17 November the company reported its quarter, presented by the interim chief executive, Colette Kress:
- Revenue of $115.8 billion, against estimates of $109.33 billion and $57.0 billion a year earlier.
- Net income of $65.3 billion, against $31.9 billion a year earlier.
- Revenue guidance of $126.1 billion to $133.9 billion for the next quarter, above the $125.25 billion expected.
The board’s chairman, Harvey Jones, said the board “does not intend to reinstate” Huang (NBC News). The shares fell 2.9% on 18 November and 3.3% on 19 November. Nvidia is down 28.7% in November alone. Strong numbers that do not lift a stock are a sign that the price was set by something other than the last quarter: here, the next chief executive and the spending plans of Nvidia’s customers.
4. A Fed that is expected to raise rates
The Federal Reserve raised its target range by a quarter point in September, to 3.75%–4.00%, and on 18 November CME Group’s FedWatch tool put the probability of another increase at the 8–9 December meeting at 95.4% (The Motley Fool, citing FedWatch). The background, from October’s inflation figures to what each Fed official said, is in our weekly recap of 13 November.
One point does not fit a simple “rates are rising” story. The 10-year Treasury yield, the rate that matters most for valuing long-term profits, closed on 19 November at 5.05%, below the 5.27% of 6 October when stocks set their record (Cboe 10-year yield index). Expectations for short-term rates rose; long-term yields did not. What a 5% 10-year yield does to the price of stocks is covered in our analysis of the 10-year at 5%.
And the largest share sale on record, on the worst day of the week
On 19 November Anthropic, the developer of the Claude AI models, began trading on Nasdaq as ANT. It sold 980 million shares at $83, above the $70–$78 range it had marketed, raising $81.3 billion, the largest IPO on record. The first trade was at $111.50 and the shares closed at $97.17, 17.1% above the offer price, for a market value of about $1.28 trillion (StockTitan, Yahoo Finance). The same day the S&P 500 fell 2.0%, the Dow 2.2% and the Nasdaq 2.3% (AP), and AMD fell 7.7%. A new listing of that size gives investors another way to own AI and asks them for $81 billion of cash at the same time; how much of Thursday’s fall that explains, the data cannot say.
What past Nasdaq falls say about this one
The Nasdaq Composite has a daily record from February 1971. Over that time it has had 31 completed declines of 10% or more from a record close, each ending when the record was regained, plus the current one:
| Nasdaq declines of 10% or more since 1971 | Count | Median time from record back to record |
|---|---|---|
| All completed declines | 31 | 168 days |
| Stopped short of 20% | 18 | 116 days (longest: 382) |
| Reached 20% or more | 13 | 524 days |
| Got at least as deep as today’s 13.5% | 19 | — |
| … of which went on to 20% or more | 13 (68%) | — |
| … median final depth | −24.9% | — |
Two readings of the same table are both correct. A decline that has reached 13.5% has more often than not gone on to 20%: every one of the 13 bear markets since 1971 passed through this point, while only 6 of the declines that reached it stopped short. But the history is short, 19 cases, and the cases are not independent of their time; the Nasdaq of the 1970s and 1980s was a much smaller and different market. The current decline is also the second of 2026: the one that began on 29 October 2025 bottomed at −13.2% on 30 March 2026 and was recovered by 15 April.
The S&P 500 is earlier in its fall. Since 1950 it has had 36 completed declines of 8.2% or more from a record. Of those, 26 reached 10% and 11 reached 20%, and the median final depth was 14.1%. The full record of how deep the bear markets went and how long they lasted is in bear markets since 1950.
Neither table is a forecast. It only says what range of outcomes has followed declines of this size before, and that range runs from a recovery within months to the 15 years the Nasdaq took after March 2000.
What an investor can check
- How much of a portfolio is in these twelve companies, through every fund at once. An S&P 500 fund, a Nasdaq-100 fund, a technology fund and an AI fund can hold the same few names several times over. Our review of AI ETFs shows how much they overlap.
- Whether the fall changes the plan or only the price. A plan written for a 20% fall should not need rewriting at 13%. A plan that assumed AI stocks only rise needs it now, before the next fall rather than during it. The rules for that are in how to manage investment risk.
- The dates that are already known. The Fed’s decision on 9 December; Nvidia’s search for a permanent chief executive, which has been given to the recruiter Heidrick & Struggles (NBC News); and the new Congress in January, when any federal data-centre proposal would be introduced.
Frequently asked questions
Why are AI stocks falling in November 2026?
Reports have tied the fall to four developments: higher borrowing costs for companies financing data centres, such as CoreWeave and Oracle; Democratic gains in the 3 November elections and votes against data centres in 40 of 41 local ballot measures; the resignation of Nvidia’s chief executive on 12 November; and expectations of a Fed rate increase in December, put at 95.4% on 18 November. On the close of 19 November, Nvidia was 39.0% below its 2026 high.
Is the stock market in a correction?
The Nasdaq Composite is: on 19 November it closed 13.5% below its 6 October record, past the usual 10% threshold. The S&P 500 was 8.2% below its record, and the equal-weighted S&P 500 ETF had returned −0.3% since 6 October, so most of the fall is in the largest technology companies.
How often does a Nasdaq correction become a bear market?
Of the 31 completed Nasdaq declines of 10% or more since 1971, 13 reached 20% or more. Of the 19 that got at least as deep as the current 13.5%, 13 went on to 20%, a share of 68% in a small sample. The corrections that stopped short of 20% took a median of 116 days to regain the record; the bear markets took a median of 524 days.
Did Nvidia’s earnings disappoint?
No. Nvidia reported revenue of $115.8 billion for its quarter, against estimates of $109.33 billion, and guided to $126.1–133.9 billion for the next quarter. The shares still fell 2.9% and 3.3% in the next two sessions, after the board said it would not reinstate Jensen Huang as chief executive.
Which sectors have held up?
From 6 October to 19 November, consumer staples returned +9.9%, health care +6.2%, utilities +4.5% and real estate +4.3%, while technology lost 20.5%. Long-term Treasuries returned +4.4% and gold −12.3%.
How we calculated this
- Data: daily closes from Yahoo Finance via yfinance, downloaded on 20 November 2026: indexes as price levels, ETFs and stocks adjusted for dividends. The 10-year yield is the Cboe index (^TNX).
- Highs and falls are measured from the highest close of 2026 for each series to the close of 19 November 2026; “since 6 Oct” is from the S&P 500’s record close.
- The AI-linked group is twelve stocks chosen for their exposure to AI spending as chip makers, cloud providers or data-centre operators: Nvidia, Microsoft, Alphabet, Amazon, Meta, Broadcom, AMD, TSMC, Oracle, Palantir, Micron and CoreWeave, rebalanced daily to equal weights. It is an illustration, not an index.
- Historical declines start at a record close, count once the index is 10% (or 8% for the S&P 500 comparison) below it, and end on the first close back at the record. Nasdaq Composite from 5 February 1971; S&P 500 from 3 January 1950.
- The calculation script and its full output, kept with the article, reproduce every figure.
Sources
- Yahoo Finance, daily price history of the indexes, ETFs and stocks named, to 19 November 2026.
- The Associated Press, “A brutal sell-off for AI stocks sends Wall Street reeling”, 5 November 2026, and “How major US stock indexes fared”, 19 November 2026.
- CNBC, data-centre ballot measures in the 2026 midterms, 4 November 2026, and AI credit default swaps, 18 November 2026.
- NBC News, Nvidia earnings live updates, 17 November 2026.
- StockTitan, Anthropic’s first trading day, and Yahoo Finance, Anthropic IPO live, 19 November 2026.
- The Motley Fool, citing CME FedWatch, 18 November 2026.
Related reading
- Nvidia and key-person risk — what happened to the CEO, and what it did to the stock.
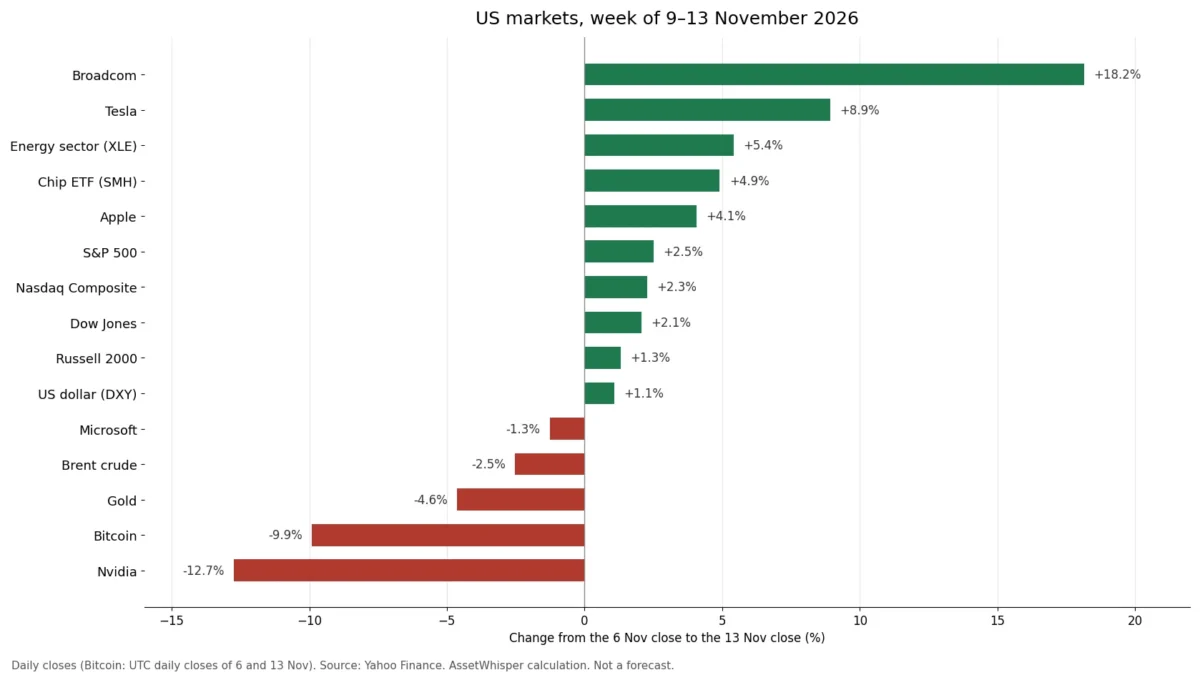
- Stock market week in review, 9–13 November — inflation, the Fed and the bond market.
- Bear markets since 1950 — how deep the falls went and how long the recoveries took.
- The AI bull market and the 1999 warning — the comparison with the dot-com peak, made before the fall.
- AI ETFs — what is inside them, and how much they overlap with the index.
This article is general information, not personalised investment advice. It does not take into account the financial situation, objectives or risk tolerance of any individual reader, and the same text is distributed to all readers. The companies named are examples of the market’s AI-linked group, not recommendations. Past performance does not indicate future results, and capital is at risk.