Stock Market Week in Review: S&P 500 +2.5% as Yields Jump After a Hot CPI (9–13 Nov 2026)
Key takeaway
The S&P 500 rose 2.51%, its best week since August, while the 2-year Treasury yield jumped 37 bp after a hot October CPI and Fed talk of a December hike. Nvidia fell 12.75% as its CEO resigned.
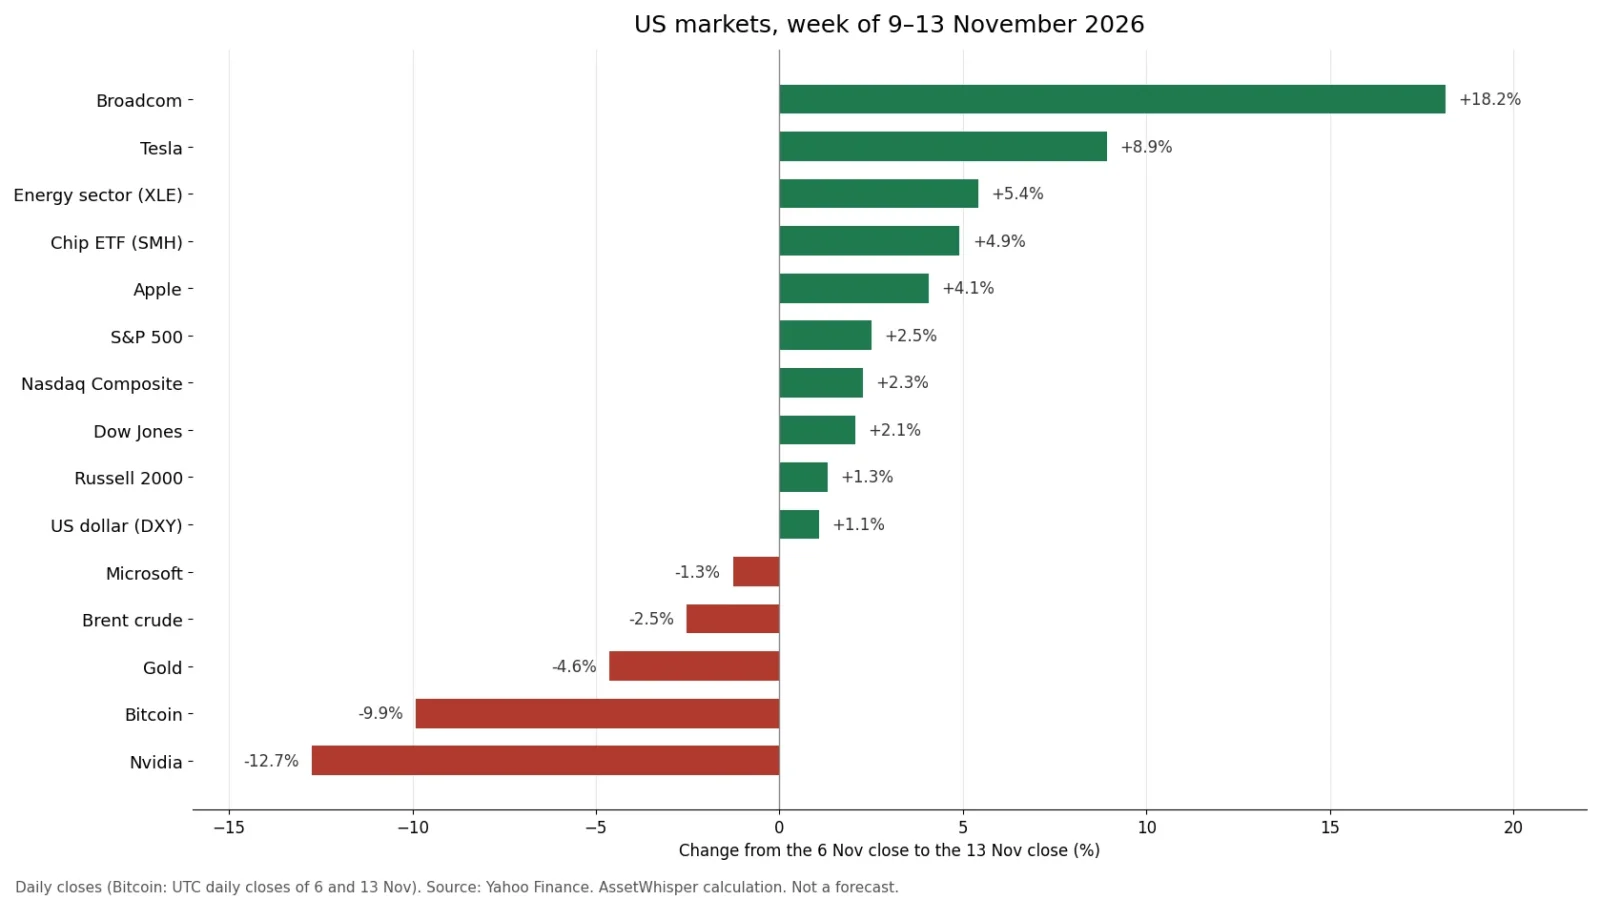
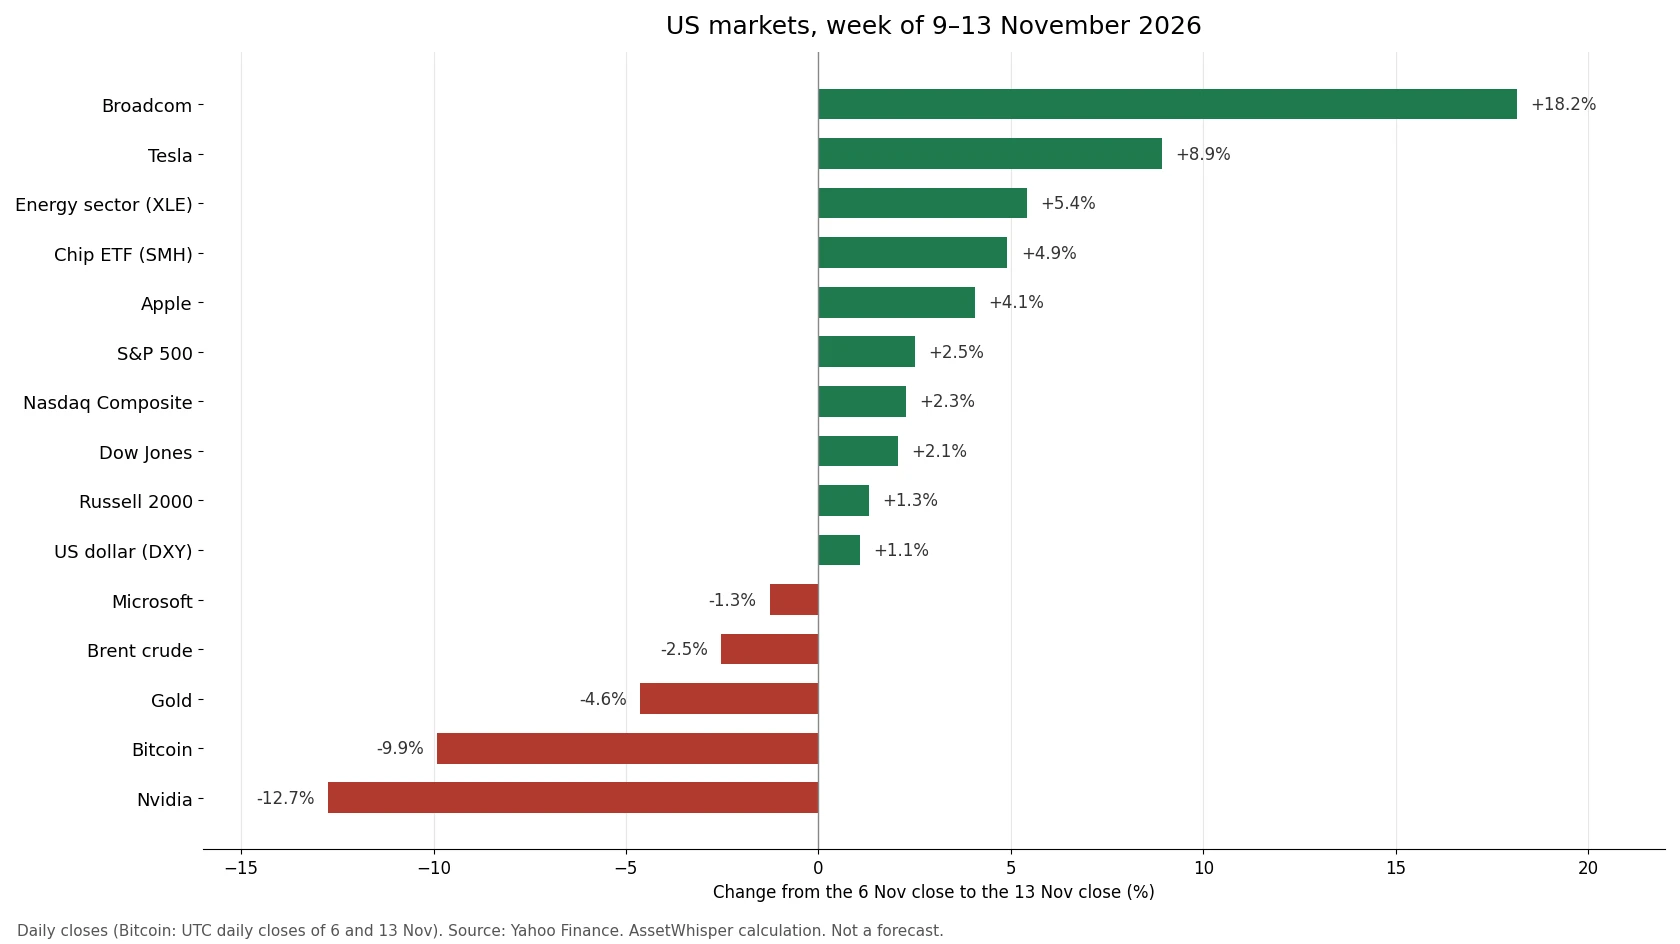
US stocks had their best week since early August while Treasury yields rose across the whole curve. The S&P 500 gained 2.51% from Friday 6 November to Friday 13 November, even though October consumer prices came in above forecasts, four Federal Reserve officials said further rate increases were likely, and the 10-year Treasury yield closed at 5.15%. Nvidia, the index’s largest chip stock, fell 12.75% in the week its chief executive resigned, while the rest of the semiconductor sector rose.
This recap sets out what moved, by how much, and which data and statements were behind it. Every market figure is a close-to-close calculation from public data; the script is listed at the end. Nothing here is a buy or sell signal or a forecast.
The week in numbers
| Market | 6 Nov close | 13 Nov close | Week |
|---|---|---|---|
| S&P 500 | 7,376.86 | 7,561.67 | +2.51% |
| Nasdaq Composite | 24,579.43 | 25,136.27 | +2.27% |
| Dow Jones Industrial Average | 51,285.73 | 52,347.55 | +2.07% |
| Russell 2000 | 2,754.11 | 2,790.49 | +1.32% |
| S&P 500 equal weight (RSP) | $216.05 | $221.16 | +2.37% |
| VIX | 25.64 | 19.30 | −6.34 points |
| 2-year Treasury yield | 4.51% | 4.88% | +37 bp |
| 10-year Treasury yield | 4.86% | 5.15% | +29 bp |
| 30-year Treasury yield | 5.26% | 5.47% | +21 bp |
| US dollar index (DXY) | 102.30 | 103.41 | +1.09% |
| Brent crude (front month) | $98.32 | $95.84 | −2.52% |
| WTI crude (front month) | $90.83 | $88.56 | −2.50% |
| Gold futures | $4,074.90 | $3,886.30 | −4.63% |
| Bitcoin (UTC daily close) | $75,747 | $68,249 | −9.90% |
Treasury yields are the official par yields published by the US Treasury; everything else is from Yahoo Finance.
Three points of context from the same data:
- Best week since early August. For the S&P 500, Nasdaq and Dow, the last Friday-to-Friday gain at least this large was the week ending 7 August 2026 (+3.58%, +5.19% and +2.96%).
- Still below the record. The S&P 500 closed 3.3% below its record close of 7,818.93 on 6 October, and the Nasdaq Composite 8.9% below its own. The S&P 500 is up 10.5% in 2026.
- The rise was broad. The equal-weight S&P 500 ETF (+2.37%) gained almost as much as the cap-weighted index (+2.51%), and all eleven sector ETFs rose.
Day by day
| Session | S&P 500 | What the session had |
|---|---|---|
| Mon 9 Nov | +2.35% | Brent fell 5.8% to $92.57. AMD rose 13.3% and Broadcom 8.8%; Nvidia fell 4.3% on the first session after its CEO’s memo to staff. |
| Tue 10 Nov | −0.38% | October CPI above forecasts; Governor Waller said a half-point hike should be considered. The 2-year yield rose 17 bp to 4.73%. |
| Wed 11 Nov | +1.31% | Veterans Day: stocks traded, the bond market was closed. The chip ETF SMH rose 4.8%. |
| Thu 12 Nov | −0.35% | Jensen Huang resigned as Nvidia’s CEO (Nvidia −4.3%). Brent rose 3.3%. Jobless claims and October home sales released. |
| Fri 13 Nov | −0.40% | October producer prices. Chip stocks gave back part of the week: AMD −8.8%, Broadcom −4.8%, Cisco −6.2% after its results. The 10-year yield rose to 5.15%. |
Inflation: October CPI and PPI
Consumer prices (released Tuesday). The Bureau of Labor Statistics reported that the CPI rose 0.4% in October, seasonally adjusted, after 0.6% in September. Core CPI, which excludes food and energy, rose 0.3% for the third month in a row. CNBC said both figures were 0.1 point above the Dow Jones consensus. The components:
| Component | October, m/m | September, m/m |
|---|---|---|
| All items | +0.4% | +0.6% |
| Core (ex food and energy) | +0.3% | +0.3% |
| Energy | +0.7% | +5.2% |
| Gasoline | +1.0% | +9.1% |
| Shelter | +0.3% | +0.4% |
| Food | +0.5% | — |
There is no 12-month inflation rate in this report. The BLS did not collect October 2025 prices because of the government shutdown, so it “cannot publish 12-month percent changes for October 2026” for those indexes. A monthly 0.3% core rate compounds to about 3.7% a year (1.00312 − 1), against the Fed’s 2% target.
Producer prices (released Friday). The PPI for final demand rose 0.3% in October after 1.4% in September. Over 12 months it was up 6.5%, the largest rise since November 2022. Excluding food, energy and trade services, producer prices rose 0.5% in the month and 4.9% over the year.
The Fed: from “a hike is likely” to “how big”
The federal funds target range is 3.75% to 4.00%. The Fed raised it by a quarter point in September and held it on 28 October by a 10–2 vote; Governor Lisa Cook and Cleveland Fed President Beth Hammack dissented in favour of another quarter-point increase (Federal Reserve). The next decision is on 8–9 December.
What officials said this week:
- Governor Christopher Waller, speaking in London on Tuesday, said he leans toward an increase in December and that if inflation came in worse than expected, “a 50 basis point hike in the policy rate should be considered”. He added: “Hiking only 25 basis points would put our credibility at risk, a risk I am not eager to take” (CNBC).
- Dallas Fed President Lorie Logan said she sees two more quarter-point increases and then a pause; Philadelphia Fed President Anna Paulson said: “For now, further gradual tightening seems appropriate” (CNBC).
- San Francisco Fed President Mary Daly: “We’re going to need to, in all likelihood, raise rates” (TheStreet).
Market pricing moved with them. After the CPI release, futures fully priced a quarter-point hike in December and put 12.5% odds on a half point (CNBC). By Friday’s close, TheStreet reported 86 basis points of hikes priced through the end of 2027, against 44 basis points a week earlier.
Bonds: the 2-year moved most
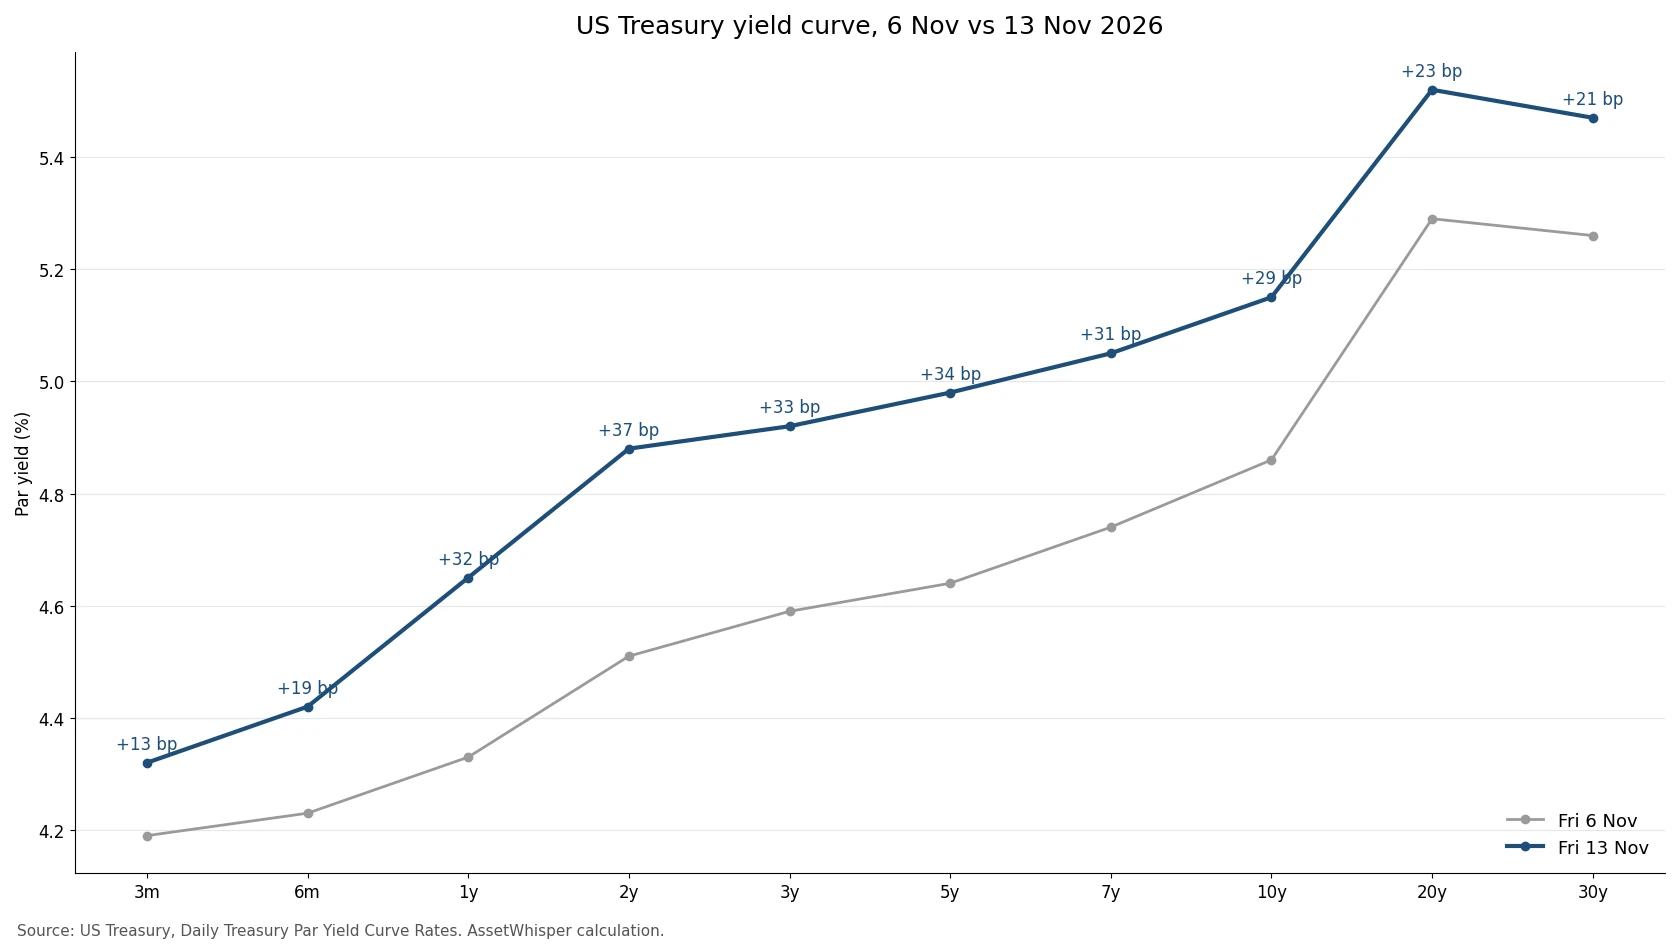
Yields rose at every maturity, and most where rate expectations bite hardest: the 2-year rose 37 bp to 4.88% and the 1-year 32 bp, against 29 bp for the 10-year and 21 bp for the 30-year. The gap between the 10-year and 2-year yields narrowed from 35 bp to 27 bp. The 10-year’s 5.15% close is its highest since 19 October; its 2026 high is 5.31%. For what a 5% 10-year yield means for stock valuations, see our analysis of real yields at 5%, and for the curve’s record as a recession signal, yield-curve inversions.
Jobs and housing
- Jobless claims. Initial claims rose 9,000 to 200,000 in the week to 7 November, against a 195,000 forecast; continuing claims fell 20,000 to 1.697 million (Reuters via the Honolulu Star-Advertiser).
- Payrolls, for context. The October jobs report, released on 6 November, showed 165,000 jobs added and unemployment at 4.1%, down from 4.2% (IndustryWeek).
- Existing home sales. They fell 5.5% in October to a seasonally adjusted annual rate of 3.75 million, the lowest since August 2010 and below the 3.85 million forecast. The median price was $421,900, up 0.4% from a year earlier (same Reuters report, citing the National Association of Realtors).
Oil, gold, the dollar and Bitcoin
Oil fell for a second week. Brent lost 5.8% on Monday, rose 3.3% on Thursday and ended the week 2.5% lower at $95.84, 18.5% below its 30 October close of $117.64. Tuesday’s $91.49 was its lowest close since 31 August. Market reports based on Reuters data cited a growing supply surplus, higher OPEC+ output in October, rising US crude and fuel inventories, and the US blockade of Iranian oil easing fears of a direct conflict; Thursday’s rebound followed unconfirmed claims of attacks on Saudi oil sites (Gate News). Lower oil did not stop the energy sector ETF (XLE) from leading the stock market, up 5.4%.
Gold fell 4.6% to $3,886.30 in a week when Treasury yields rose and the dollar index gained 1.1% to 103.41, the highest close in our three-month data set. We explain the mechanism in gold and real yields. Bitcoin fell 9.9% between the UTC daily closes of the two Fridays and dropped to $64,128 on Saturday 14 November.
Nvidia’s CEO resigns while the rest of the chip sector rallies
On Thursday 12 November, Nvidia announced that Jensen Huang had resigned as president, chief executive and director, “effective immediately”. Chief financial officer Colette Kress is interim CEO while remaining CFO, Harvey C. Jones, a former Synopsys chief executive, becomes the company’s first-ever chair, and the board is searching for a permanent CEO among internal and external candidates (Nvidia 8-K). The background is in our article on the Huang scandal and key-person risk.
| Stock or fund | 13 Nov close | Week |
|---|---|---|
| Nvidia (NVDA) | $162.85 | −12.75% |
| VanEck Semiconductor ETF (SMH) | $486.75 | +4.91% |
| Broadcom (AVGO) | $347.01 | +18.16% |
| AMD | $534.06 | +18.93% |
| Cisco (CSCO) | $95.64 | +1.91% |
Nvidia is 31.9% below its 6 October record close of $239.24. With about 24.1 billion shares outstanding (its latest 10-Q), that fall is roughly $1.8 trillion of market value. Nvidia is down 12.7% in 2026; Apple, by contrast, closed the week at a record $356.27, up 31% this year.
Among the other large companies: Tesla +8.9%, Meta +5.2%, Apple +4.1%, Alphabet +3.9%, Amazon +2.8% and Microsoft −1.3%.
Sectors
| Sector (SPDR ETF) | Week |
|---|---|
| Energy (XLE) | +5.42% |
| Industrials (XLI) | +3.76% |
| Communication services (XLC) | +3.72% |
| Technology (XLK) | +3.36% |
| Financials (XLF) | +2.66% |
| Consumer staples (XLP) | +2.52% |
| Health care (XLV) | +2.19% |
| Utilities (XLU) | +2.11% |
| Consumer discretionary (XLY) | +2.04% |
| Real estate (XLRE) | +0.84% |
| Materials (XLB) | +0.54% |
The spread between the best and worst sector was 4.9 percentage points; real estate and materials gained least in a week when the 10-year yield rose 29 bp and the dollar 1.1%.
What is scheduled next
- Tuesday 17 November: Nvidia’s third-quarter fiscal 2027 results, after the close (call at 2 p.m. Pacific), its first report under the interim CEO (Nvidia). Home Depot and Disney also report (TheStreet).
- Wednesday 18 November: minutes of the 27–28 October Fed meeting, where two members voted for a hike.
- During the week: Empire State and Philadelphia Fed manufacturing surveys, industrial production, housing data, weekly jobless claims (Thursday), Walmart results (Thursday) and the final University of Michigan sentiment reading for November (Friday 20 November; the preliminary reading was 51.0).
- Further out: November jobs report on 4 December, Fed decision on 8–9 December, November CPI on 10 December.
Sources and method
- Prices: Yahoo Finance daily closes for indexes, sector ETFs, stocks, front-month Brent, WTI and gold futures, the ICE dollar index and Bitcoin (UTC daily closes), downloaded on 15 November 2026. Weekly change = 13 Nov close / 6 Nov close − 1.
- Yields: US Treasury, Daily Treasury Par Yield Curve Rates.
- Bureau of Labor Statistics: CPI, October 2026; PPI, October 2026.
- Federal Reserve: FOMC statement, 28 October 2026.
- Nvidia: CEO transition, Exhibit 99.1 to Form 8-K, 12 November 2026.
- CNBC: October CPI, Waller; TheStreet: weekly close; Reuters via the Honolulu Star-Advertiser; Gate News (oil); IndustryWeek (payrolls).
- Calculation script:
2026-11-15-weekly-market-recap.calc.py
Related reading
- Nvidia’s Jensen Huang scandal — the timeline before the resignation and what key-person risk means for index investors.
- The 10-year Treasury at 5% — why real yields, not inflation, drove the move.
- The equity risk premium in 2026 — what stocks pay over bonds when yields are this high.
- Gold and real yields — the relationship behind gold’s weekly fall.
Educational content. Not investment advice.