The TRIX Indicator: Formula, Lag and a Reproducible Test on the S&P 500
Key takeaway
TRIX is the daily change of a price smoothed three times. On the S&P 500 since 1954, the 15-day TRIX lagged 21 trading days on average and crossed zero a third as often as a same-lag average, but no TRIX rule beat buy-and-hold on return, nor a same-exposure mix after 1992.
TRIX is the daily percentage change of a price that has been smoothed three times with the same exponential average. Jack Hutson introduced it in Technical Analysis of Stocks & Commodities in 1983 as a way to filter out short price moves. The filtering is real, and so is its price: on the S&P 500, a 15-day TRIX reflects prices from about 21 trading days ago on average, the same as a 43-day simple average.
We measured both sides on the S&P 500 from January 1954 to September 2026: how late TRIX reacts, how often it changes its mind, and what the textbook TRIX rules earned after costs. The 15-day TRIX crossed zero 5.8 times a year, against 17.9 for a simple average with the same lag. In 13 bear markets it took a median of 14 trading days to turn negative after the peak and 23 to turn positive after the low. No TRIX rule we tested beat buy-and-hold on return in either half of the sample, and none beat a fixed stock-and-bill mix of the same exposure after 1992.
The formula, step by step
For a 15-day TRIX on daily closes:
- Take the 15-day exponential moving average (EMA) of the close. Each day it moves 2/16 = 12.5% of the way from yesterday’s value to today’s close.
- Take the 15-day EMA of that line.
- Take the 15-day EMA of the second line. This is the triple-smoothed price.
- TRIX is today’s triple-smoothed value divided by yesterday’s, minus 1, times 100.
Most charting packages also draw a signal line, a 9-day EMA of TRIX itself. The two usual readings are TRIX crossing zero, which means the triple-smoothed price has stopped rising or falling, and TRIX crossing its signal line, which is earlier and noisier.
TRIX is a percentage, so its scale is small. For the 15-day TRIX on the S&P 500 since 1954, 90% of daily readings fell between −0.22 and +0.24. Because it is a rate of change, it is close to a triple-smoothed average of the daily percentage changes themselves: from 1954 to 2026 the two series had a correlation of 0.998.
How much TRIX lags
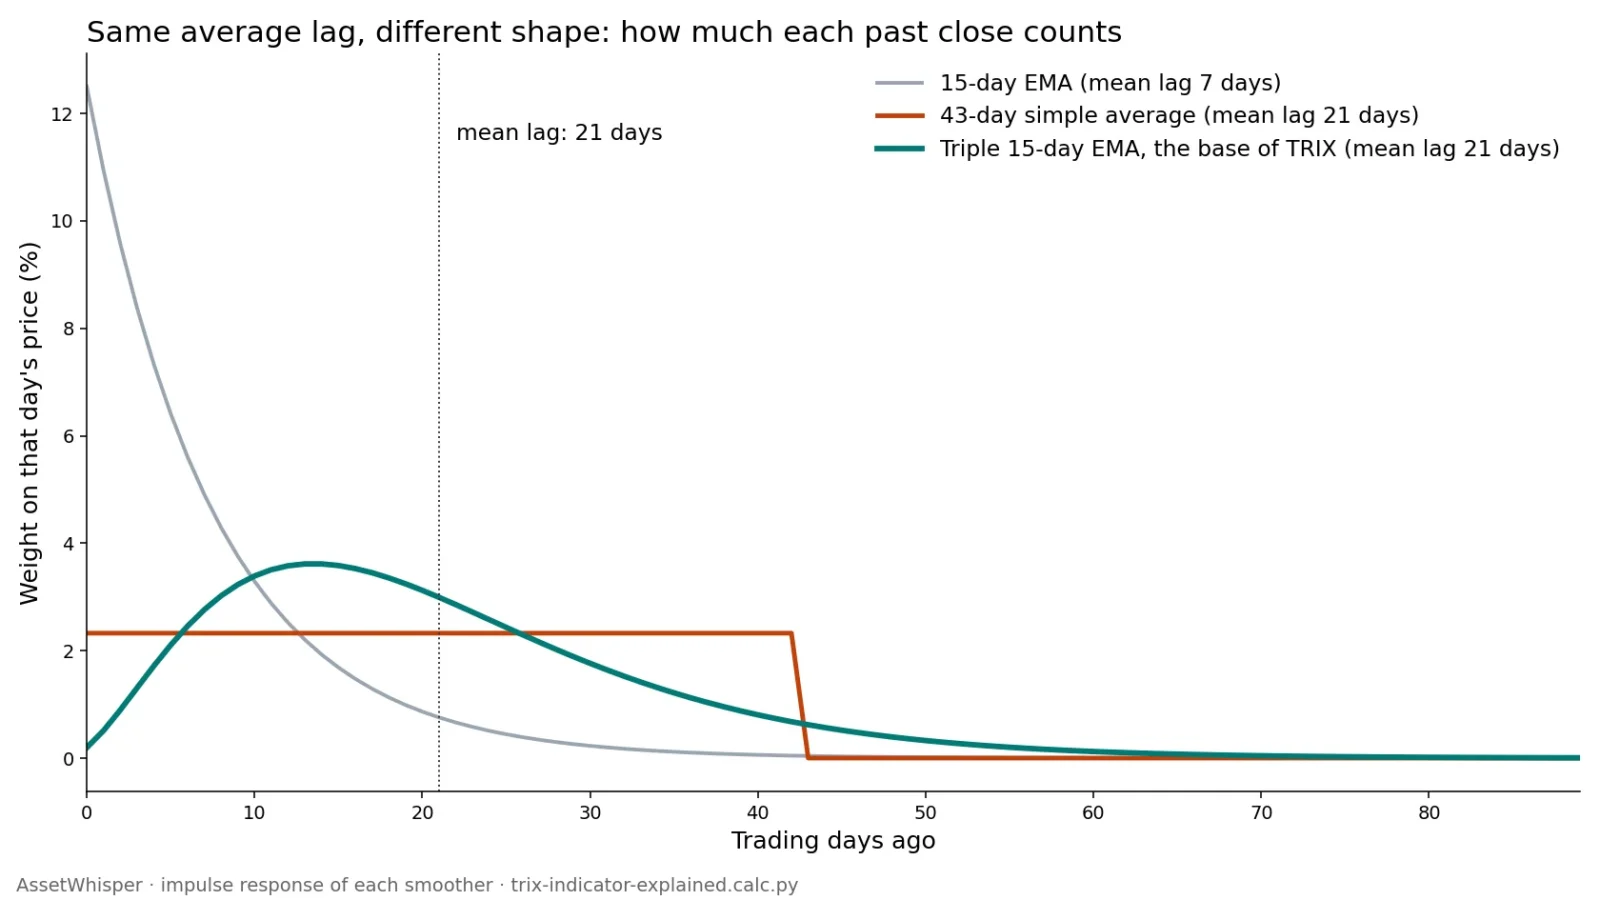
Every average is a weighted sum of past prices, and its lag is the average age of the prices it uses. A 15-day EMA has a mean lag of (15−1)/2 = 7 days. Smoothing three times adds the lags: 3 × 7 = 21 days. We checked it numerically by feeding a single price spike into each average and recording the weight it gave each day.
| TRIX length | Mean lag | Median lag | Heaviest day | Same-lag SMA |
|---|---|---|---|---|
| 9 days | 12.0 | 11 | 8 | 25 days |
| 12 days | 16.5 | 15 | 10 | 34 days |
| 15 days | 21.0 | 19 | 13 | 43 days |
| 20 days | 28.5 | 25 | 18 | 58 days |
| 30 days | 43.5 | 39 | 29 | 88 days |
Lags in trading days. The last column is the simple moving average (SMA) whose mean lag, (n−1)/2, matches.
The chart shows where the smoothing comes from. A single EMA gives today’s close the most weight. The triple EMA gives the last few days very little: its weights rise to a peak 13 days back and fade slowly after that. A day’s jump therefore barely moves TRIX on the day, which is why the line looks calm. It also means TRIX responds late to a genuine change in direction.
Smoother than an average of the same lag
The point of triple smoothing is fewer false turns at a given lag. That part holds. Counting every time each line switched between “in” and “out” from 1954 to September 2026:
| Line | Switches a year | Days “in” |
|---|---|---|
| TRIX 15 above zero | 5.8 | 64.9% |
| TRIX 15 above its signal | 12.2 | 49.1% |
| Price above 43-day SMA | 17.9 | 63.8% |
| Price above 200-day SMA | 6.0 | 71.3% |
| Up day (no smoothing) | 119.6 | 53.1% |
At the same 21-day mean lag, the zero line of TRIX changed side about a third as often as price crossing a 43-day average, and about as rarely as price crossing a 200-day average. The signal-line version gives back much of that calm: it switched 12.2 times a year, because the 9-day signal is a short average of an already-turning line.
How late it turned in 13 bear markets
Since 1954 the S&P 500 had 13 declines of at least 20% from a closing high, counting a decline as over once the index rose 20% from its low. For each, we recorded how many trading days after the peak each line first said “out”, and how many after the low it first said “in”, with the index’s move from the peak or low at that close.
| Median of 13 | Out after peak | Index by then | In after low | Index by then |
|---|---|---|---|---|
| TRIX 15 > 0 | 14 days | −4.8% | 23 days | +12.6% |
| TRIX 15 > signal | 4 days | −1.7% | 6 days | +6.8% |
| Price > 43-day SMA | 7 days | −3.3% | 11 days | +10.9% |
| Price > 200-day SMA | 21 days | −7.2% | 81 days | +19.3% |
Two cautions on reading it. These are the first switches after each turn. A noisy line that flickers out and straight back in near a top scores well here, and the switch counts above show how often that happens. And the medians hide a wide spread. In 2020 the zero line said “out” 7 days after the February peak, with the index already 12.8% lower. After the March low it said “in” 23 days later, 26.8% above the low.
The pattern is the trade-off from the weights chart. At the same mean lag, TRIX’s zero line reacted later at turns than price crossing a 43-day average, in exchange for switching a third as often the rest of the time.
A reproducible test of the TRIX rules
We used the method of our indicator test. Each rule holds the S&P 500 with dividends when its line is “in” and 3-month Treasury bills when it is “out”, trading at the close after the signal and paying 5 basis points per switch. Each is compared with buy-and-hold and with a naive mix: a fixed share of the index and bills equal to the rule’s average time in stocks. 1954–1992 and 1993–September 2026 are reported separately.
| 1993–Sep 2026 | In stocks | Return a year | Naive mix | Sharpe | Worst fall |
|---|---|---|---|---|---|
| Buy and hold | 100% | 10.89% | n/a | 0.52 | −55.3% |
| TRIX 15 > signal 9 | 49% | 5.99% | 6.99% | 0.35 | −27.1% |
| TRIX 15 > 0 | 68% | 7.30% | 8.54% | 0.45 | −26.7% |
| TRIX 9 > 0 | 65% | 6.70% | 8.31% | 0.41 | −27.0% |
| TRIX 12 > 0 | 67% | 7.53% | 8.44% | 0.47 | −25.5% |
| TRIX 20 > 0 | 71% | 7.54% | 8.74% | 0.46 | −30.6% |
| TRIX 30 > 0 | 73% | 8.32% | 8.92% | 0.51 | −32.0% |
| Price > 43-day SMA | 67% | 5.18% | 8.42% | 0.29 | −34.0% |
Every TRIX rule earned less than its naive mix after 1992, by 0.6 to 1.6 points a year, and had a lower Sharpe ratio than the index (0.52). What the rules did buy was a shallower worst fall: 25% to 32%, against 55.3% for the index and 30% to 43% for the same-exposure mixes. Most of that came from two declines: from the October 2007 peak to the March 2009 low, TRIX 15 against zero was in stocks 26% of the days and lost 16.9%, while the index lost 54.9%. On a single historical path, the worst fall is the least reliable number in the table.
The 1954–1992 half tells the same story on return. The best TRIX rule, 15 days against zero, earned 9.64% a year against 11.74% for buy-and-hold and 9.77% for its mix. Over those years the 43-day average was the only rule here that beat its mix, by 0.81 points. After 1992 it was the worst, 3.24 points behind. A rule that wins in one half and loses badly in the other is what noise looks like.
The textbook signal-line rule, TRIX 15 against its 9-day signal, was the weakest TRIX rule in both halves. It is the version most often drawn on charts.
What TRIX is useful for, and what it is not
- It is a clean description of trend direction. TRIX above zero means the triple-smoothed price is rising. At a given lag, it says so with fewer reversals than a price-and-average crossover.
- It does not see turns early. Its weights favour prices two to three weeks old, so it confirms a change in direction rather than anticipating it.
- Its trading rules did not add return on this index. On the S&P 500 since 1954, after costs, no TRIX rule we tested beat buy-and-hold on return, and none beat a fixed mix of the same exposure after 1992.
- Divergences were not tested. Price making a new high while TRIX makes a lower one is a common reading. It needs a definition of “high” that adds several free choices, and we did not test it.
Frequently asked questions
What is the TRIX indicator?
TRIX is the one-day percentage change of a price smoothed three times by the same exponential moving average. Jack Hutson introduced it in Technical Analysis of Stocks & Commodities in 1983. The usual setting is 15 days, with a 9-day exponential average of TRIX as a signal line.
How much does a 15-day TRIX lag the price?
On average 21 trading days: each 15-day exponential average has a mean lag of 7 days, and smoothing three times adds them. That is the same mean lag as a 43-day simple average. The weights peak 13 days back.
Is TRIX better than a moving average crossover?
It is smoother at the same lag. On the S&P 500 from 1954 to 2026 its zero line switched 5.8 times a year, against 17.9 for price crossing a 43-day average. In 13 bear markets it reacted later at turns: a median 14 days after the peak, against 7.
Does a TRIX trading rule beat buy-and-hold?
Not in our test on the S&P 500 with dividends, after 5 basis points per trade. From 1993 to September 2026 the textbook 15-day TRIX with a 9-day signal earned 5.99% a year, against 10.89% for buy-and-hold and 6.99% for a fixed mix with the same 49% in stocks.
What TRIX settings should I use?
This article cannot answer that for any individual. It describes how TRIX is built and how several settings behaved on one index under stated assumptions, and contains no trade signals or recommendations.
How we calculated this
- Data and method: the same as our indicator test. Yahoo Finance ^GSPC daily closes (before March 1957, the S&P 90). Total return adds one 252nd of Robert Shiller’s dividend yield to each daily price return; since 1988 it tracks the S&P 500 total-return index with a daily correlation of 0.9996. Cash is the 3-month Treasury bill from the Federal Reserve’s H.15. Sample 5 January 1954 to 30 September 2026.
- Indicator: exponential averages with weight 2/(n+1), seeded at the first close of the price history from December 1927, so every line is formed by 1954. TRIX = 100 × (triple EMA today / triple EMA yesterday − 1). Lags come from feeding a single unit spike into each average.
- Bear markets: on daily closes, a decline of at least 20% from the running high, ended when the index rises 20% from the lowest close. “Out after peak” is the first close on or after the peak with the line out of the market; “in after low” is the first close on or after the low with the line in.
- Rules: a signal at the close of day t is traded at the close of day t+1; long or bills only; 5 basis points per side per switch. The naive mix holds the rule’s average share in stocks, rebalanced daily at the same cost. The TRIX 15/9 figures match our earlier indicator test to the hundredth. The TRIX zero-line rules were among its 90 variants; the 43-day average is added here only as a same-lag comparison.
- Limits: one index, closing prices, no taxes or fund fees, one historical path; past behaviour is not a forecast. The script that prints every figure is kept with this article’s working files.
Sources
- Jack K. Hutson, “Good TRIX”, Technical Analysis of Stocks & Commodities, 1(5), July/August 1983, pp. 105–108.
- Data: Yahoo Finance (^GSPC, ^SP500TR); Robert J. Shiller, U.S. stock market data; Federal Reserve Board, H.15 Selected Interest Rates. Retrieved 21 October 2026.
Related reading
- How to test a technical indicator before trusting it — the full method, with 90 variants and the multiple-testing correction.
- The 10-month moving average on the S&P 500 — the monthly trend rule over 92 years.
- AssetWhisper indicators — the indicator library.
This article is general information, not personalised investment advice. It does not take into account the financial situation, objectives, tax position or risk tolerance of any individual reader, and the same text is distributed to all readers. Simulated results describe the past under stated assumptions and are not forecasts. Trading costs, taxes and fund fees reduce returns. Capital is at risk.