Investor Mindset: Five Rules That Survive a Bad Decade
Key takeaway
The investor mindset that shows up in money is a set of decisions made before the bad year: automatic contributions, a written rebalancing rule, a loss limit set in advance and a buy-back rule for anything you sell. In our 1988–2026 simulation, pausing contributions during falls cost 3.7% of the final sum; selling at −20% and waiting for the old high cost 54.7%.

Most writing about the investor mindset describes an attitude: patient, disciplined, curious, calm under pressure. None of that can be observed, and none of it is what decides the result. What can be observed is behaviour: when money went in, when it came out, and whether the plan was still running in the second year of a bear market. Measured that way, the investor mindset that matters is not a personality. It is a short list of decisions made in advance, while nothing is happening, so that nothing has to be decided when everything is.
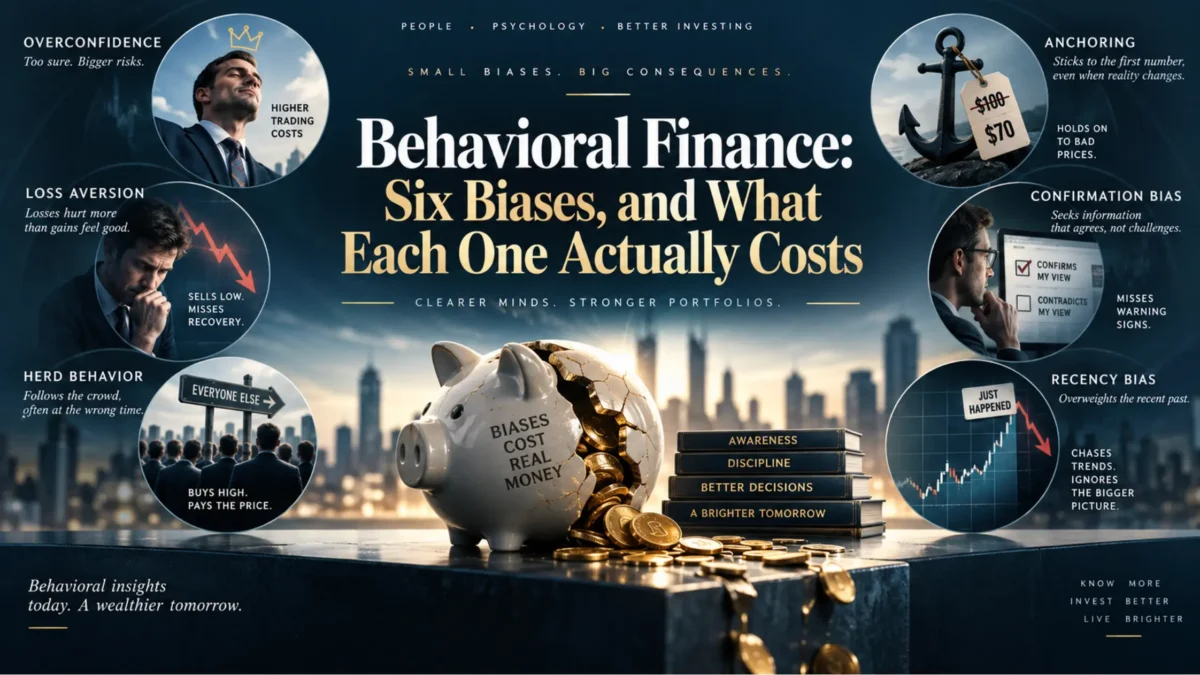
This article sets out those decisions, what the evidence says each one is worth, and where the evidence is weaker than its reputation. It does not catalogue biases — our piece on behavioural biases and what each one costs does that. The subject here is the system that makes the biases irrelevant.
The habit, the rule, the evidence
Every habit on the usual list can be turned into a rule that runs without willpower. The right-hand column is what has been measured when people follow the rule, or fail to.
| What the lists call it | What it looks like as a rule | What has been measured |
|---|---|---|
| Consistency | Contributions leave the account automatically, on a fixed date | 401(k) participation of 86% for new hires enrolled by default, against 37% when they had to opt in (Madrian & Shea, 2001) |
| Ambition | The contribution rate rises automatically with each pay rise | Average saving rate of participants rose from 3.5% to 13.6% in 40 months (Thaler & Benartzi, 2004) |
| Discipline | A written rebalancing rule, or a fund that rebalances for you | 1% of Vanguard plan participants holding a single target-date fund traded in 2024, against 11% of those holding a mix of funds |
| Emotional control | A maximum loss decided before the fall, turned into an equity weight | A 60% equity weight would lose about 33% in a repeat of 2007–09; the allocation, not the temperament, sets the size of the hole |
| Long-term thinking | A fixed, infrequent schedule for looking at the portfolio | Subjects given frequent feedback bet 50.5% of their stake; those given it less often bet 67.4% (Gneezy & Potters, 1997) |
| Conviction | No exit rule without a re-entry rule written in the same sentence | Selling at −20% and waiting for the old high cut a monthly saver’s 1988–2026 result by 54.7% (own calculation below) |
The practical consequence: none of these rules requires you to feel differently. They work by removing the moments at which a feeling can become a transaction.
How to measure an investor mindset: the gap between a fund and its investors
If mindset shows up anywhere in money, it shows up in the difference between what a fund earned and what the people holding it earned. The two differ when money arrives after good runs and leaves after bad ones. Morningstar estimates it every year in its Mind the Gap study.
The 2026 edition, summarised by Morningstar on 6 August 2026, finds that the average dollar invested in US mutual funds and ETFs earned 8.7% a year over the ten years to 31 December 2025, against 9.9% for the funds themselves: a gap of 1.2 percentage points a year. Compounded on $10,000 for ten years, the two rates come to $25,703 and $23,030. That is an illustration of the rates, not anyone’s account.
The headline is less useful than the breakdown, because the breakdown shows where the gap lives.
| US category group | Investor return | Fund total return | Gap, points a year |
|---|---|---|---|
| US equity | 12.85% | 13.29% | −0.44 |
| Allocation (including target-date) | 7.77% | 8.43% | −0.66 |
| Taxable bond | 1.94% | 2.97% | −1.03 |
| International equity | 7.78% | 8.85% | −1.07 |
| Municipal bond | 1.09% | 2.23% | −1.14 |
| Sector equity | 9.36% | 10.58% | −1.22 |
| Alternative | 2.56% | 4.11% | −1.55 |
| All funds | 8.74% | 9.89% | −1.15 |
Two groups had the smallest gaps: broad US equity, whose investors largely stayed put through a very good decade, and allocation funds. Morningstar attributes the second to what the product does for its holders: it rebalances internally, and it is usually bought through routine payroll contributions. Sorted by volatility instead of category, the pattern is sharper: the least volatile fifth of funds had a gap of 0.42 points, the most volatile fifth 2.11. The extreme case is new: from January 2024 to June 2026 the average dollar in US spot bitcoin ETFs lost about 5.8% a year while the ETFs returned 8.5%, a gap of more than 14 points, which Morningstar attributes to the largest inflows arriving after the price had already risen.
One caveat, and it is not small. A paper in the Financial Analysts Journal (Fulkerson, Jordan, Riley and Yan, 2026) re-examined the previous edition and concluded that, on the same sample, poor timing cost fund investors about 0.10% a year rather than 1.2%. The disagreement is about how cash flows are weighted, and it has not been settled. We do not know whether the correction changes the ranking of categories as well as the level; the paper addresses the headline.
The practical consequence: treat the size of the average gap as disputed and the direction as the lesson. Where the product or the payroll made the decisions, investors kept more of what their funds earned. Where every decision was discretionary and the asset moved a lot, they kept less.
What the investors who stay invested actually do
A detailed annual record of what ordinary savers actually do is Vanguard’s How America Saves, which covers more than 1,400 US workplace plans and nearly 5 million participants. Its 2025 edition, covering 2024, reports that 95% of non-advised participants made no exchange at all during the year. Only 5% moved money between funds. Among participants whose whole account sat in a single target-date fund, 1% traded; among those holding anything other than a single target-date or balanced fund, 11%.
The crisis years are the informative ones. Participant-directed trading reached 14% of participants in 2008 and 10% in 2020 — elevated, but it means that more than eight in ten did nothing through the worst months of either decade. Vanguard’s 2026 edition, published in June, says the same held in 2025: only 5% traded during periods of volatility.
It would be flattering to read this as a nation of disciplined savers. The more plausible reading is that most of them never had to exercise discipline. Their contributions were deducted before they saw them, their allocation was set by a default, and doing nothing was the path of least effort. That is the design working. One caution: people who choose a single target-date fund may be less interested in markets to begin with, so the 1% versus 11% comparison mixes the effect of the product with the kind of person who picks it.
What a written rule is worth: four savers, one index, 1988–2026
To price the difference between a rule and a reaction, we ran four savers through the same history. Each puts $500 into the S&P 500 total return index (dividends reinvested) on the first trading day of every month, from January 1988 to September 2026: 465 contributions, $232,500 in all. Cash earns the three-month Treasury bill rate. A “fall” starts at the first close 20% or more below the previous high and ends at the first close back at that high. There were four: 2001–2006, 2008–2012, 2020, and 2022–2023.
| Saver | What they do in a fall | Value on 24 Sep 2026 | Money-weighted return | vs automatic |
|---|---|---|---|---|
| A. Automatic | Nothing. Contributions continue | $3,306,260 | 11.09% a year | — |
| B. Pauser | Stops buying, holds new money in cash, invests the pile once the index is back at its high | $3,184,831 | 10.95% a year | −3.7% |
| C. Waits for the all-clear | Sells everything at −20%, buys back at the old high | $1,496,215 | 8.09% a year | −54.7% |
| D. Written round trip | Sells everything at −20%, buys back once the index is 20% above its low | $3,528,852 | 11.33% a year | +6.7% |
Three results, and the third is the one most articles would leave out.
Pausing is cheap; selling is not. Stopping contributions for 29% of the period cost the pauser 3.7% of the final sum, because the money was still saved and eventually invested. Selling cost the saver who waited for the all-clear more than half. Each time they sold 20% to 27% below the high and bought back at or slightly above it, giving up 20% to 27% of their holding per round trip. Four round trips compound to −54.7%. That is the same arithmetic as the recovery that arrives before it feels safe, applied to a saver rather than an index.
The cost is in the way back, not the way out. Saver D sold on the same days as saver C and finished ahead of the automatic saver. The difference is a re-entry rule written in advance and followed while the news was still bad.
And D’s lead is one trade. Episode by episode, D bought back 34% more units than it sold in 2008, when the index fell 55%. In 2001 it broke even. In 2020 and 2022 it bought back fewer units than it sold, because the rebound arrived before the fall went much further. A rule that wins once, draws once and loses twice in four tries is not an edge; it is a bet on the next fall being deep. It also ignores tax: in a taxable account, each sale can realise a gain on units bought years earlier.
The practical consequence: the question to ask of any sell decision is not whether it is right, but whether it comes with a buy-back rule you would follow at −40% with the headlines at their worst. If it does not, the evidence above says you are choosing saver C.
A framework for investing success: five rules written before the bad year
Each rule below is written so that it can be carried out mechanically. None requires a market view, and all of them are easier to adopt in a calm year than in a bad one — which is the point of adopting them now.
1. Automate the contribution, and the increase
Some of the most robust evidence in household finance is about defaults. When a large US employer switched to automatic enrolment, participation among new hires at 3 to 15 months’ tenure rose from 37% to 86%. Vanguard’s 2025 report puts participation at 94% in plans with automatic enrolment and 64% in plans without. Nothing about the plans changed except who had to act.
The same study has a warning. Of those enrolled automatically, 61% stayed at the default 3% contribution invested entirely in a money market fund. Inertia keeps you in the plan and keeps you in whatever the plan chose. So choose the default deliberately, once, and then let it run. The companion rule is to make the rate rise by itself. In the original Save More Tomorrow programme, 78% of employees offered the scheme joined, 80% stayed through four pay rises, and their average saving rate went from 3.5% to 13.6% over 40 months. In Vanguard plans in 2025, 31% of participants raised their contribution through automatic annual escalation.
If you invest from income, each contribution goes in as soon as it exists, which is simply investing. It is not dollar-cost averaging in the sense the research on lump sums versus phasing in examines, and no change is needed.
2. Write the rebalancing rule down
A rebalancing rule makes you sell what has risen and buy what has fallen, which is why it tends to be skipped exactly when it matters. The version we recommend in our guide to how often to rebalance is short enough to survive a bad year: check once a year on a fixed date, act only if a sleeve is more than five points from target, use new contributions before selling anything. The alternative is a fund that rebalances internally, which is one of the reasons Morningstar gives for the small gap in allocation funds.
3. Set the loss limit cold, then derive the allocation from it
Risk tolerance asked in the abstract produces optimistic answers. Asked as a number — how large a fall in the whole portfolio you would sit through without selling — it produces an allocation. If equities repeated their 2007–09 decline (−55.3% for the S&P 500 with dividends, from October 2007 to March 2009) and everything else held its value, the arithmetic is:
| Largest portfolio fall you would sit through | Equity weight that stays inside it | Gain needed to recover |
|---|---|---|
| 15% | 27% | +17.6% |
| 20% | 36% | +25.0% |
| 25% | 45% | +33.3% |
| 30% | 54% | +42.9% |
| 35% | 63% | +53.8% |
The “everything else holds” assumption is generous: in 2022 bonds fell alongside stocks, so treat the right-hand weights as ceilings. Writing the number down matters more than its exact size, because a limit set during a fall is set by the fall. Our risk profile quiz scores this the same way, by the tightest of your constraints rather than the sum of your answers, and the reasoning is in what type of investor are you. For individual holdings the same logic becomes position sizing.
4. Decide how often you look
How often you check changes what you see. On the S&P 500 total return index from 1988 to September 2026:
| If you look every… | Share of periods showing a loss |
|---|---|
| Day | 45.5% |
| Month | 34.1% |
| Quarter | 25.3% |
| Calendar year (1989–2025) | 18.9% |
| Rolling 5 years | 12.1% |
| Rolling 10 years | 7.0% |
A daily checker sees about 115 losing days a year from an asset that lost money over only 7% of ten-year windows. That matters because the frequency of feedback changes decisions, not just mood. In a laboratory experiment with 84 students at Tilburg University, subjects who saw results after every round bet 50.5% of their stake on a favourable gamble; those who saw results every three rounds bet 67.4%. Same gamble, same odds, less risk taken by the people given more information. Pick a review date — quarterly is plenty for a long-term portfolio — and treat the rest as noise.
5. Never write an exit without the way back in
If you keep the option to sell in a crisis, write the re-entry condition in the same sentence and make it mechanical: a date, a level, a percentage off the low. The four-saver table shows why. Selling cost less than the waiting that followed it. Our ranking of stock market mistakes by cost reaches the same place from daily data: the best days cluster inside the worst stretches, and sellers are out for them.
What to ignore
A plan also needs a list of things it will not respond to. Ours would be short:
- Daily moves. Nearly half of all trading days are down. A single day rarely tells a long-term plan anything it did not already assume.
- The price you paid. It is a fact about your past, not about the asset, and it is the source of the disposition effect.
- Whatever just went up most. The crypto ETF inflows above arrived after the rise, and Morningstar finds the widest gaps in the most volatile funds.
- Forecasts of the bottom. In the median bear market since 1950, most of the climb back happened within a year of the low, before conditions felt settled.
Why discipline beats conviction
Conviction is a feeling about a forecast, and it tends to peak at the wrong time: after a run, when the story is most persuasive, and at the bottom, in the other direction. Morningstar’s crypto ETF case is conviction measured in flows: the money arrived after the story had moved the price and left after it reversed.
Discipline needs no forecast. A contribution on the first of the month, an annual rebalancing check and a written loss limit all work whether you are optimistic or frightened, and the first two work best when you are frightened, because they buy what fell. That is the case for the investor mindset as a system rather than a temperament: a system can be built on a quiet afternoon and still be working in the eighth year of a drawdown.
Frequently asked questions
What is an investor mindset?
In practice, the decisions an investor has made in advance so that a bad market does not require new ones: how money goes in, when the portfolio is rebalanced, how large a fall it is built to absorb, and when anything is sold. It shows up in trading records and contribution histories, not in attitude.
What is a good framework for investing success?
Five rules written before they are needed: automate contributions and their annual increase, write a rebalancing rule (an annual check with a five-point band is a reasonable default), set a maximum portfolio loss and derive the equity weight from it, fix how often you review the portfolio, and never keep a sell rule without a mechanical buy-back rule. Each removes a moment at which a feeling could become a transaction.
How do you develop an investing mindset?
Mostly by building the structure first and letting experience follow. Written rules, automatic contributions and a fixed review date can be adopted today; the confidence to hold through a real drawdown tends to come from having done it once, with a portfolio sized so that it was possible.
What separates successful investors from the rest?
On the measured evidence, less activity at the wrong moments. Morningstar’s 2026 study found the smallest gaps between fund and investor returns in broad US equity and allocation funds, while the most volatile fifth of funds showed a gap of about two points a year. The size of the average gap is disputed; the pattern is consistent: fewer discretionary decisions, better outcomes.
How do I build a habit of consistent investing?
Remove the monthly decision. Contributions deducted automatically on a fixed date continue through bad markets because nobody has to choose to make them. When a large US employer made enrolment automatic, participation among new hires rose from 37% to 86%, although none of the plan’s economic features changed.
Should I stop investing when the market falls?
Pausing is less damaging than it feels, provided the money is saved and invested later: in our simulation from 1988 to 2026, it cost 3.7% of the final sum. Selling and waiting until the market regained its old high cost 54.7%. The difference is almost entirely in the buy-back.
How can you tell what kind of investor mindset you have?
Look at your record rather than your self-description. What did you do in the last fall of 20% or more? How often do you check the portfolio? Is there a written rule for buying back anything you sell? The answers say more than any questionnaire, though a questionnaire scored by your tightest constraint is a reasonable starting point.
Sources
- Jeffrey Ptak, “The Winning Formula for Fund Investors, and Why Others Left Money on the Table”, Morningstar, 6 August 2026, summarising Mind the Gap 2026. Investor return 8.74% vs total return 9.89% for US open-end funds and ETFs, ten years to 31 December 2025 (excluding commodities and funds of funds); category and volatility-quintile gaps from the article’s published chart data; spot bitcoin ETFs 11 January 2024 to 30 June 2026.
- Jon A. Fulkerson, Bradford D. Jordan, Timothy B. Riley and Qing Yan, “Bad Timing Does Not Cost Investors 15% of Their Funds’ Returns: An Examination of Morningstar’s ‘Mind the Gap’ Study”, Financial Analysts Journal 82(3), 2026. Timing cost of 0.10% a year on the sample of the 2025 study.
- Vanguard, How America Saves 2025, June 2025, data for 2024: more than 1,400 plans and nearly 5 million participants; participant trading (Figures 97 and 100); participation of 94% with automatic enrolment and 64% without.
- Vanguard, press release for How America Saves 2026, 16 June 2026 (5% of participants traded during periods of volatility in 2025), and Previewing How America Saves 2026, 4 March 2026 (31% raised their deferral rate through automatic escalation).
- Brigitte C. Madrian and Dennis F. Shea, “The Power of Suggestion: Inertia in 401(k) Participation and Savings Behavior”, Quarterly Journal of Economics 116(4), 2001, pp. 1149–1187 (NBER Working Paper 7682). Participation at 3–15 months’ tenure of 37% before and 86% after automatic enrolment; 61% of automatically enrolled employees at the full default.
- Richard H. Thaler and Shlomo Benartzi, “Save More Tomorrow: Using Behavioral Economics to Increase Employee Saving”, Journal of Political Economy 112(S1), February 2004, pp. S164–S187.
- Uri Gneezy and Jan Potters, “An Experiment on Risk Taking and Evaluation Periods”, Quarterly Journal of Economics 112(2), 1997, pp. 631–645. Table I, average share of endowment bet over rounds 1–9.
- Own calculations: S&P 500 Total Return index (Yahoo Finance, ^SP500TR), daily closes 4 January 1988 to 24 September 2026, retrieved 25 September 2026; three-month Treasury bill rate from FRED (series TB3MS) for interest on cash. Covers the share of losing periods by frequency, the four-saver simulation and the loss-limit table. No taxes or trading costs are included.
Related reading
- Behavioral finance: six biases and what each one costs — the catalogue this article deliberately skips.
- Stock market mistakes, ranked by what they cost — including what selling into a fall costs on daily data.
- Bear markets since 1950 — how long a plan has to survive, measured.
- How often should you rebalance? — the rule that buys the fall.
- Lump sum vs dollar-cost averaging — what to do with money you already have.
- What type of investor are you? — setting the loss limit before it is tested.
This article is general information, not personalised investment advice. It does not take into account the financial situation, objectives or risk tolerance of any individual reader, and the same text is distributed to all readers. The simulations describe one index over one historical period, exclude taxes and costs, and do not predict future results; the saver who sold and bought back 20% off the low is an illustration, not a recommended strategy. Capital is at risk and past performance does not indicate future results.